Immigrants from Iraq vs Immigrants from Lebanon Births to Unmarried Women
COMPARE
Immigrants from Iraq
Immigrants from Lebanon
Births to Unmarried Women
Births to Unmarried Women Comparison
Immigrants from Iraq
Immigrants from Lebanon
27.1%
BIRTHS TO UNMARRIED WOMEN
99.8/ 100
METRIC RATING
31st/ 347
METRIC RANK
25.3%
BIRTHS TO UNMARRIED WOMEN
100.0/ 100
METRIC RATING
14th/ 347
METRIC RANK
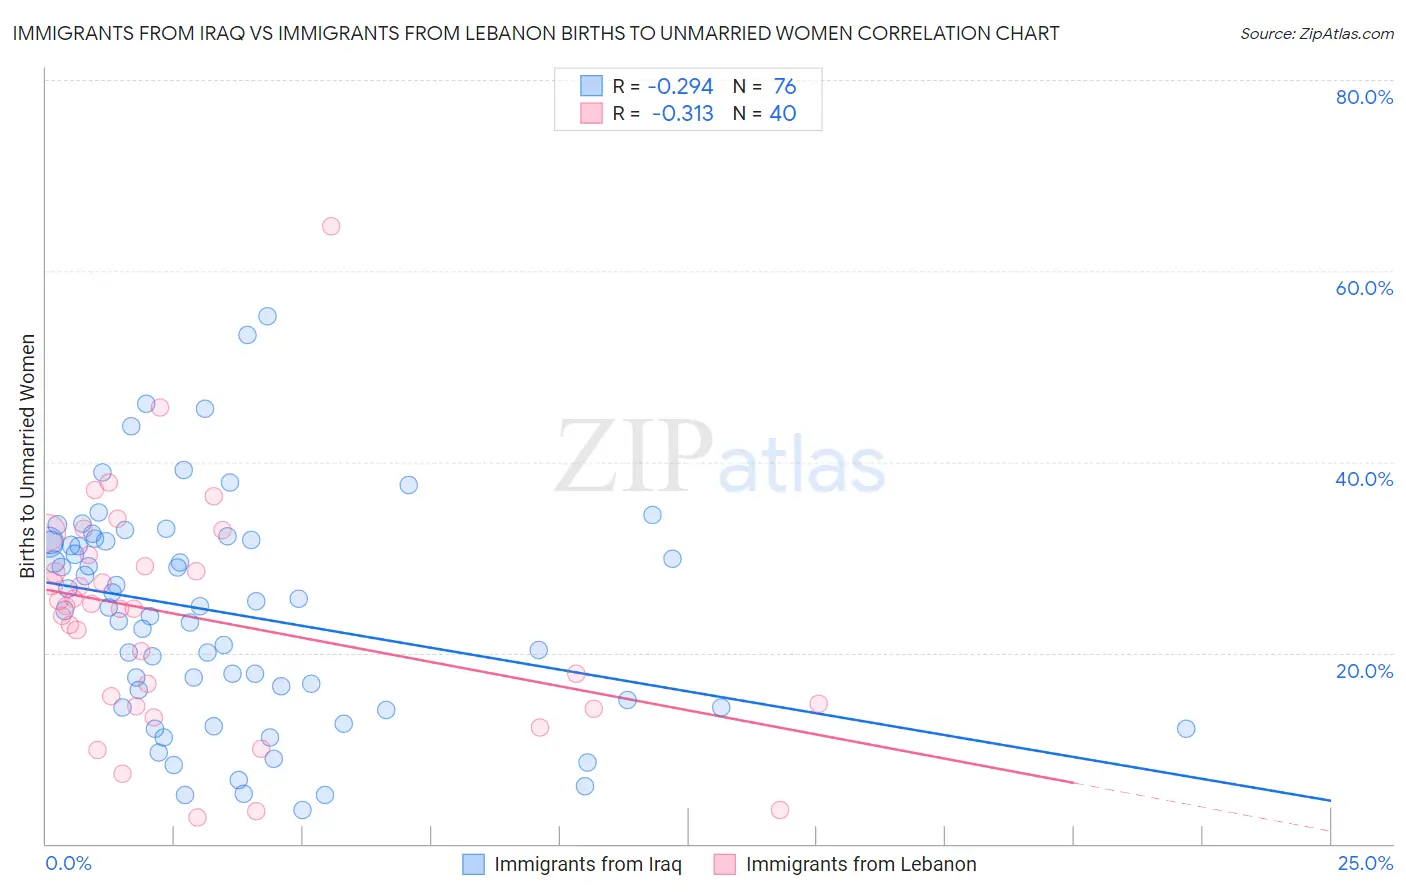
Immigrants from Iraq vs Immigrants from Lebanon Births to Unmarried Women Correlation Chart
The statistical analysis conducted on geographies consisting of 187,409,646 people shows a weak negative correlation between the proportion of Immigrants from Iraq and percentage of births to unmarried women in the United States with a correlation coefficient (R) of -0.294 and weighted average of 27.1%. Similarly, the statistical analysis conducted on geographies consisting of 205,801,524 people shows a mild negative correlation between the proportion of Immigrants from Lebanon and percentage of births to unmarried women in the United States with a correlation coefficient (R) of -0.313 and weighted average of 25.3%, a difference of 7.1%.
Births to Unmarried Women Correlation Summary
| Measurement | Immigrants from Iraq | Immigrants from Lebanon |
| Minimum | 3.6% | 2.7% |
| Maximum | 55.3% | 64.7% |
| Range | 51.7% | 62.0% |
| Mean | 24.1% | 23.7% |
| Median | 24.8% | 24.8% |
| Interquartile 25% (IQ1) | 14.6% | 14.5% |
| Interquartile 75% (IQ3) | 31.8% | 29.7% |
| Interquartile Range (IQR) | 17.1% | 15.2% |
| Standard Deviation (Sample) | 11.6% | 12.2% |
| Standard Deviation (Population) | 11.5% | 12.0% |
Demographics Similar to Immigrants from Iraq and Immigrants from Lebanon by Births to Unmarried Women
In terms of births to unmarried women, the demographic groups most similar to Immigrants from Iraq are Immigrants from Russia (27.1%, a difference of 0.030%), Bulgarian (27.1%, a difference of 0.29%), Cypriot (27.0%, a difference of 0.45%), Okinawan (26.9%, a difference of 0.81%), and Immigrants from Asia (26.8%, a difference of 1.3%). Similarly, the demographic groups most similar to Immigrants from Lebanon are Iranian (25.3%, a difference of 0.12%), Indian (Asian) (25.3%, a difference of 0.26%), Immigrants from Singapore (25.6%, a difference of 1.2%), Immigrants from Belarus (25.6%, a difference of 1.2%), and Immigrants from Uzbekistan (25.8%, a difference of 1.8%).
| Demographics | Rating | Rank | Births to Unmarried Women |
| Indians (Asian) | 100.0 /100 | #12 | Exceptional 25.3% |
| Iranians | 100.0 /100 | #13 | Exceptional 25.3% |
| Immigrants | Lebanon | 100.0 /100 | #14 | Exceptional 25.3% |
| Immigrants | Singapore | 100.0 /100 | #15 | Exceptional 25.6% |
| Immigrants | Belarus | 100.0 /100 | #16 | Exceptional 25.6% |
| Immigrants | Uzbekistan | 100.0 /100 | #17 | Exceptional 25.8% |
| Immigrants | Armenia | 99.9 /100 | #18 | Exceptional 26.1% |
| Armenians | 99.9 /100 | #19 | Exceptional 26.2% |
| Immigrants | Korea | 99.9 /100 | #20 | Exceptional 26.3% |
| Soviet Union | 99.9 /100 | #21 | Exceptional 26.3% |
| Burmese | 99.9 /100 | #22 | Exceptional 26.4% |
| Immigrants | Japan | 99.9 /100 | #23 | Exceptional 26.4% |
| Immigrants | Australia | 99.9 /100 | #24 | Exceptional 26.6% |
| Cambodians | 99.9 /100 | #25 | Exceptional 26.7% |
| Asians | 99.9 /100 | #26 | Exceptional 26.8% |
| Immigrants | Asia | 99.9 /100 | #27 | Exceptional 26.8% |
| Okinawans | 99.8 /100 | #28 | Exceptional 26.9% |
| Cypriots | 99.8 /100 | #29 | Exceptional 27.0% |
| Bulgarians | 99.8 /100 | #30 | Exceptional 27.1% |
| Immigrants | Iraq | 99.8 /100 | #31 | Exceptional 27.1% |
| Immigrants | Russia | 99.8 /100 | #32 | Exceptional 27.1% |