Immigrants from Iran vs Immigrants from Philippines Family Households
COMPARE
Immigrants from Iran
Immigrants from Philippines
Family Households
Family Households Comparison
Immigrants from Iran
Immigrants from Philippines
64.1%
FAMILY HOUSEHOLDS
30.4/ 100
METRIC RATING
185th/ 347
METRIC RANK
68.3%
FAMILY HOUSEHOLDS
100.0/ 100
METRIC RATING
10th/ 347
METRIC RANK
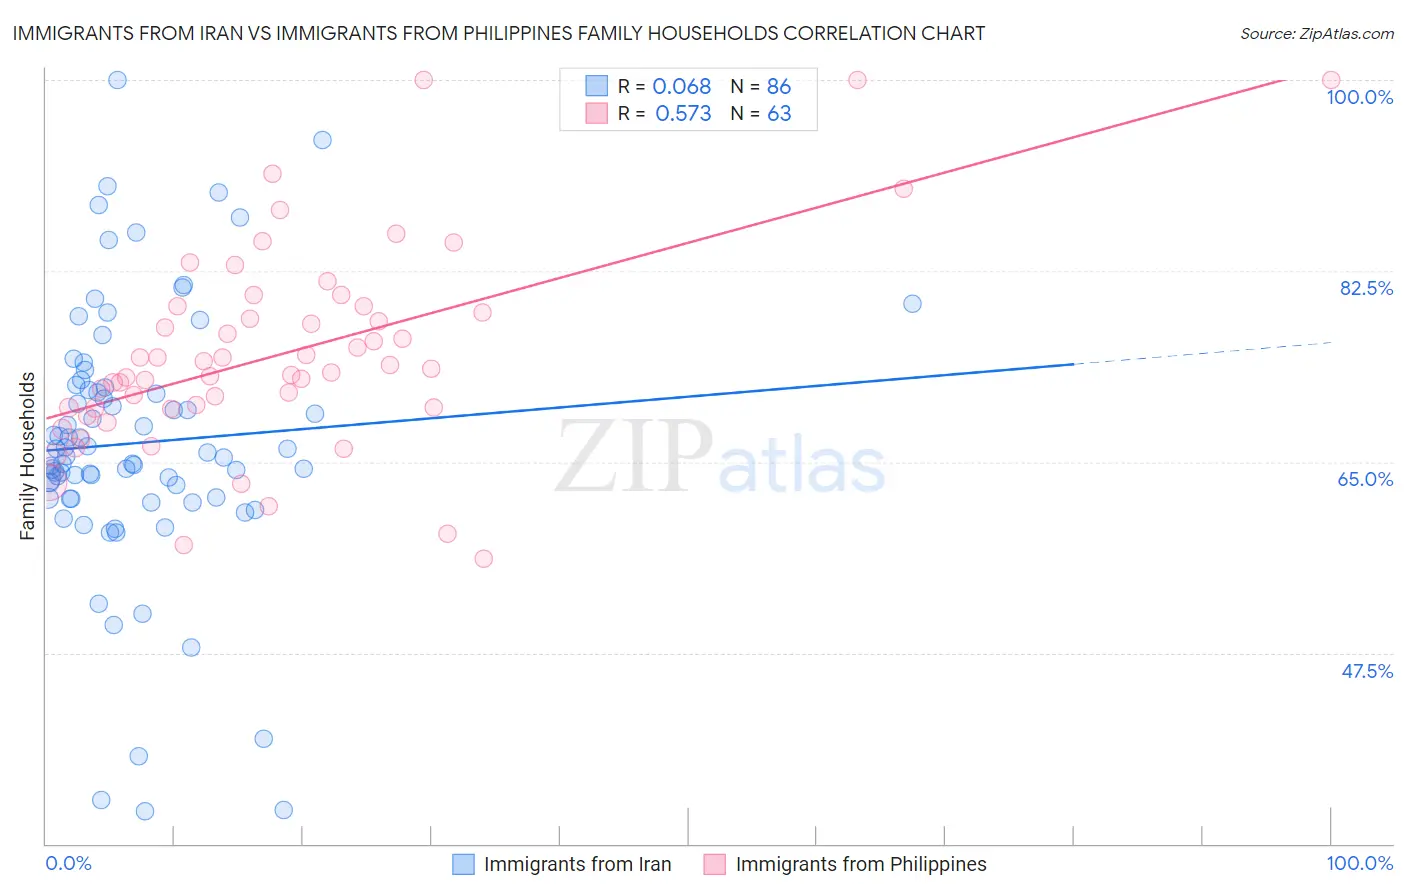
Immigrants from Iran vs Immigrants from Philippines Family Households Correlation Chart
The statistical analysis conducted on geographies consisting of 279,831,456 people shows a slight positive correlation between the proportion of Immigrants from Iran and percentage of family households in the United States with a correlation coefficient (R) of 0.068 and weighted average of 64.1%. Similarly, the statistical analysis conducted on geographies consisting of 471,023,329 people shows a substantial positive correlation between the proportion of Immigrants from Philippines and percentage of family households in the United States with a correlation coefficient (R) of 0.573 and weighted average of 68.3%, a difference of 6.6%.
Family Households Correlation Summary
| Measurement | Immigrants from Iran | Immigrants from Philippines |
| Minimum | 33.0% | 56.2% |
| Maximum | 100.0% | 100.0% |
| Range | 67.0% | 43.8% |
| Mean | 66.7% | 74.9% |
| Median | 65.7% | 73.6% |
| Interquartile 25% (IQ1) | 61.7% | 69.9% |
| Interquartile 75% (IQ3) | 71.8% | 79.3% |
| Interquartile Range (IQR) | 10.2% | 9.3% |
| Standard Deviation (Sample) | 12.3% | 9.3% |
| Standard Deviation (Population) | 12.3% | 9.2% |
Similar Demographics by Family Households
Demographics Similar to Immigrants from Iran by Family Households
In terms of family households, the demographic groups most similar to Immigrants from Iran are Spanish American (64.1%, a difference of 0.010%), Northern European (64.1%, a difference of 0.040%), Puerto Rican (64.2%, a difference of 0.050%), Ukrainian (64.2%, a difference of 0.060%), and Creek (64.2%, a difference of 0.060%).
| Demographics | Rating | Rank | Family Households |
| Jamaicans | 40.6 /100 | #178 | Average 64.2% |
| Immigrants | Ukraine | 38.2 /100 | #179 | Fair 64.2% |
| Immigrants | Honduras | 35.0 /100 | #180 | Fair 64.2% |
| Immigrants | Trinidad and Tobago | 34.9 /100 | #181 | Fair 64.2% |
| Ukrainians | 34.6 /100 | #182 | Fair 64.2% |
| Creek | 34.1 /100 | #183 | Fair 64.2% |
| Puerto Ricans | 33.4 /100 | #184 | Fair 64.2% |
| Immigrants | Iran | 30.4 /100 | #185 | Fair 64.1% |
| Spanish Americans | 30.1 /100 | #186 | Fair 64.1% |
| Northern Europeans | 28.2 /100 | #187 | Fair 64.1% |
| Paraguayans | 26.7 /100 | #188 | Fair 64.1% |
| Immigrants | Western Asia | 25.3 /100 | #189 | Fair 64.1% |
| Zimbabweans | 24.7 /100 | #190 | Fair 64.1% |
| Arabs | 24.5 /100 | #191 | Fair 64.1% |
| Lithuanians | 23.8 /100 | #192 | Fair 64.0% |
Demographics Similar to Immigrants from Philippines by Family Households
In terms of family households, the demographic groups most similar to Immigrants from Philippines are Native Hawaiian (68.4%, a difference of 0.070%), Immigrants from Central America (68.3%, a difference of 0.070%), Korean (68.3%, a difference of 0.10%), Pueblo (68.2%, a difference of 0.18%), and Immigrants from Cuba (68.2%, a difference of 0.19%).
| Demographics | Rating | Rank | Family Households |
| Tongans | 100.0 /100 | #3 | Exceptional 69.6% |
| Yakama | 100.0 /100 | #4 | Exceptional 69.3% |
| Yuman | 100.0 /100 | #5 | Exceptional 69.3% |
| Immigrants | Mexico | 100.0 /100 | #6 | Exceptional 69.1% |
| Mexicans | 100.0 /100 | #7 | Exceptional 69.0% |
| Immigrants | Fiji | 100.0 /100 | #8 | Exceptional 68.8% |
| Native Hawaiians | 100.0 /100 | #9 | Exceptional 68.4% |
| Immigrants | Philippines | 100.0 /100 | #10 | Exceptional 68.3% |
| Immigrants | Central America | 100.0 /100 | #11 | Exceptional 68.3% |
| Koreans | 100.0 /100 | #12 | Exceptional 68.3% |
| Pueblo | 100.0 /100 | #13 | Exceptional 68.2% |
| Immigrants | Cuba | 100.0 /100 | #14 | Exceptional 68.2% |
| Assyrians/Chaldeans/Syriacs | 100.0 /100 | #15 | Exceptional 68.2% |
| Immigrants | Vietnam | 100.0 /100 | #16 | Exceptional 68.2% |
| Chinese | 100.0 /100 | #17 | Exceptional 68.1% |