Immigrants from Iran vs Immigrants from Cuba Divorced or Separated
COMPARE
Immigrants from Iran
Immigrants from Cuba
Divorced or Separated
Divorced or Separated Comparison
Immigrants from Iran
Immigrants from Cuba
10.6%
DIVORCED OR SEPARATED
100.0/ 100
METRIC RATING
18th/ 347
METRIC RANK
15.2%
DIVORCED OR SEPARATED
0.0/ 100
METRIC RATING
347th/ 347
METRIC RANK
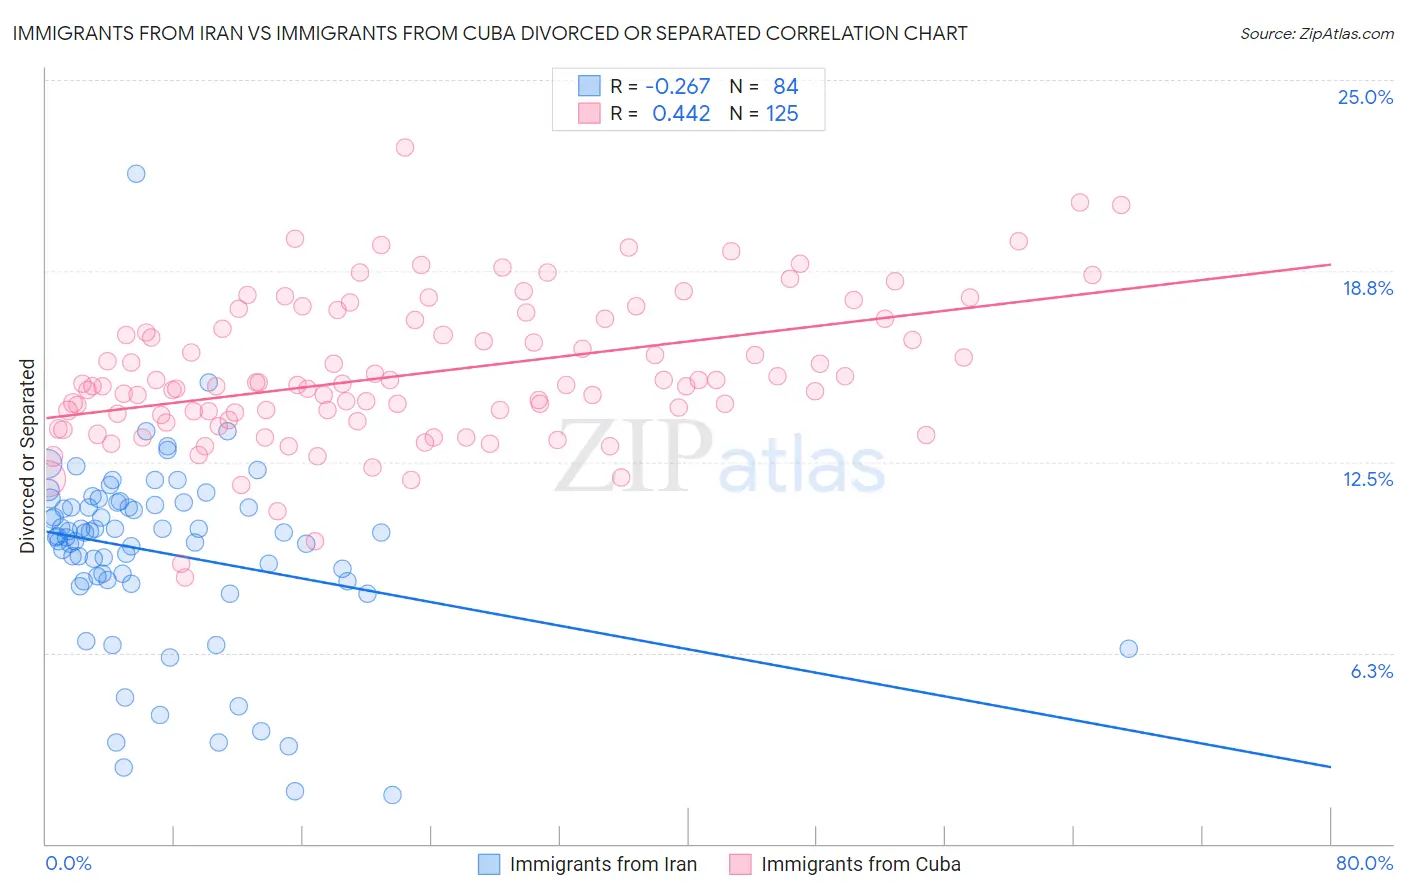
Immigrants from Iran vs Immigrants from Cuba Divorced or Separated Correlation Chart
The statistical analysis conducted on geographies consisting of 279,868,346 people shows a weak negative correlation between the proportion of Immigrants from Iran and percentage of population currently divorced or separated in the United States with a correlation coefficient (R) of -0.267 and weighted average of 10.6%. Similarly, the statistical analysis conducted on geographies consisting of 325,985,435 people shows a moderate positive correlation between the proportion of Immigrants from Cuba and percentage of population currently divorced or separated in the United States with a correlation coefficient (R) of 0.442 and weighted average of 15.2%, a difference of 43.2%.
Divorced or Separated Correlation Summary
| Measurement | Immigrants from Iran | Immigrants from Cuba |
| Minimum | 1.6% | 8.7% |
| Maximum | 21.9% | 22.8% |
| Range | 20.3% | 14.1% |
| Mean | 9.5% | 15.4% |
| Median | 10.1% | 15.0% |
| Interquartile 25% (IQ1) | 8.6% | 14.0% |
| Interquartile 75% (IQ3) | 11.1% | 17.2% |
| Interquartile Range (IQR) | 2.5% | 3.2% |
| Standard Deviation (Sample) | 3.1% | 2.4% |
| Standard Deviation (Population) | 3.1% | 2.4% |
Similar Demographics by Divorced or Separated
Demographics Similar to Immigrants from Iran by Divorced or Separated
In terms of divorced or separated, the demographic groups most similar to Immigrants from Iran are Asian (10.6%, a difference of 0.0%), Immigrants from Israel (10.6%, a difference of 0.090%), Immigrants from Korea (10.6%, a difference of 0.19%), Immigrants from Armenia (10.6%, a difference of 0.63%), and Assyrian/Chaldean/Syriac (10.6%, a difference of 0.70%).
| Demographics | Rating | Rank | Divorced or Separated |
| Immigrants | South Central Asia | 100.0 /100 | #11 | Exceptional 10.4% |
| Okinawans | 100.0 /100 | #12 | Exceptional 10.5% |
| Cypriots | 100.0 /100 | #13 | Exceptional 10.5% |
| Assyrians/Chaldeans/Syriacs | 100.0 /100 | #14 | Exceptional 10.6% |
| Immigrants | Armenia | 100.0 /100 | #15 | Exceptional 10.6% |
| Immigrants | Korea | 100.0 /100 | #16 | Exceptional 10.6% |
| Immigrants | Israel | 100.0 /100 | #17 | Exceptional 10.6% |
| Immigrants | Iran | 100.0 /100 | #18 | Exceptional 10.6% |
| Asians | 100.0 /100 | #19 | Exceptional 10.6% |
| Burmese | 100.0 /100 | #20 | Exceptional 10.7% |
| Immigrants | Asia | 100.0 /100 | #21 | Exceptional 10.7% |
| Vietnamese | 100.0 /100 | #22 | Exceptional 10.8% |
| Immigrants | Pakistan | 100.0 /100 | #23 | Exceptional 10.8% |
| Immigrants | Sri Lanka | 100.0 /100 | #24 | Exceptional 10.8% |
| Iranians | 100.0 /100 | #25 | Exceptional 10.8% |
Demographics Similar to Immigrants from Cuba by Divorced or Separated
In terms of divorced or separated, the demographic groups most similar to Immigrants from Cuba are Arapaho (14.8%, a difference of 2.8%), Kiowa (14.5%, a difference of 4.9%), Cuban (14.5%, a difference of 5.0%), Creek (14.4%, a difference of 5.7%), and Seminole (14.3%, a difference of 6.8%).
| Demographics | Rating | Rank | Divorced or Separated |
| Puerto Ricans | 0.0 /100 | #333 | Tragic 13.9% |
| Immigrants | Bahamas | 0.0 /100 | #334 | Tragic 13.9% |
| Dutch West Indians | 0.0 /100 | #335 | Tragic 14.0% |
| Shoshone | 0.0 /100 | #336 | Tragic 14.0% |
| Crow | 0.0 /100 | #337 | Tragic 14.1% |
| Choctaw | 0.0 /100 | #338 | Tragic 14.1% |
| Colville | 0.0 /100 | #339 | Tragic 14.2% |
| Chickasaw | 0.0 /100 | #340 | Tragic 14.2% |
| Bahamians | 0.0 /100 | #341 | Tragic 14.2% |
| Seminole | 0.0 /100 | #342 | Tragic 14.3% |
| Creek | 0.0 /100 | #343 | Tragic 14.4% |
| Cubans | 0.0 /100 | #344 | Tragic 14.5% |
| Kiowa | 0.0 /100 | #345 | Tragic 14.5% |
| Arapaho | 0.0 /100 | #346 | Tragic 14.8% |
| Immigrants | Cuba | 0.0 /100 | #347 | Tragic 15.2% |