Immigrants from Iran vs Immigrants from El Salvador Divorced or Separated
COMPARE
Immigrants from Iran
Immigrants from El Salvador
Divorced or Separated
Divorced or Separated Comparison
Immigrants from Iran
Immigrants from El Salvador
10.6%
DIVORCED OR SEPARATED
100.0/ 100
METRIC RATING
18th/ 347
METRIC RANK
11.7%
DIVORCED OR SEPARATED
97.9/ 100
METRIC RATING
105th/ 347
METRIC RANK
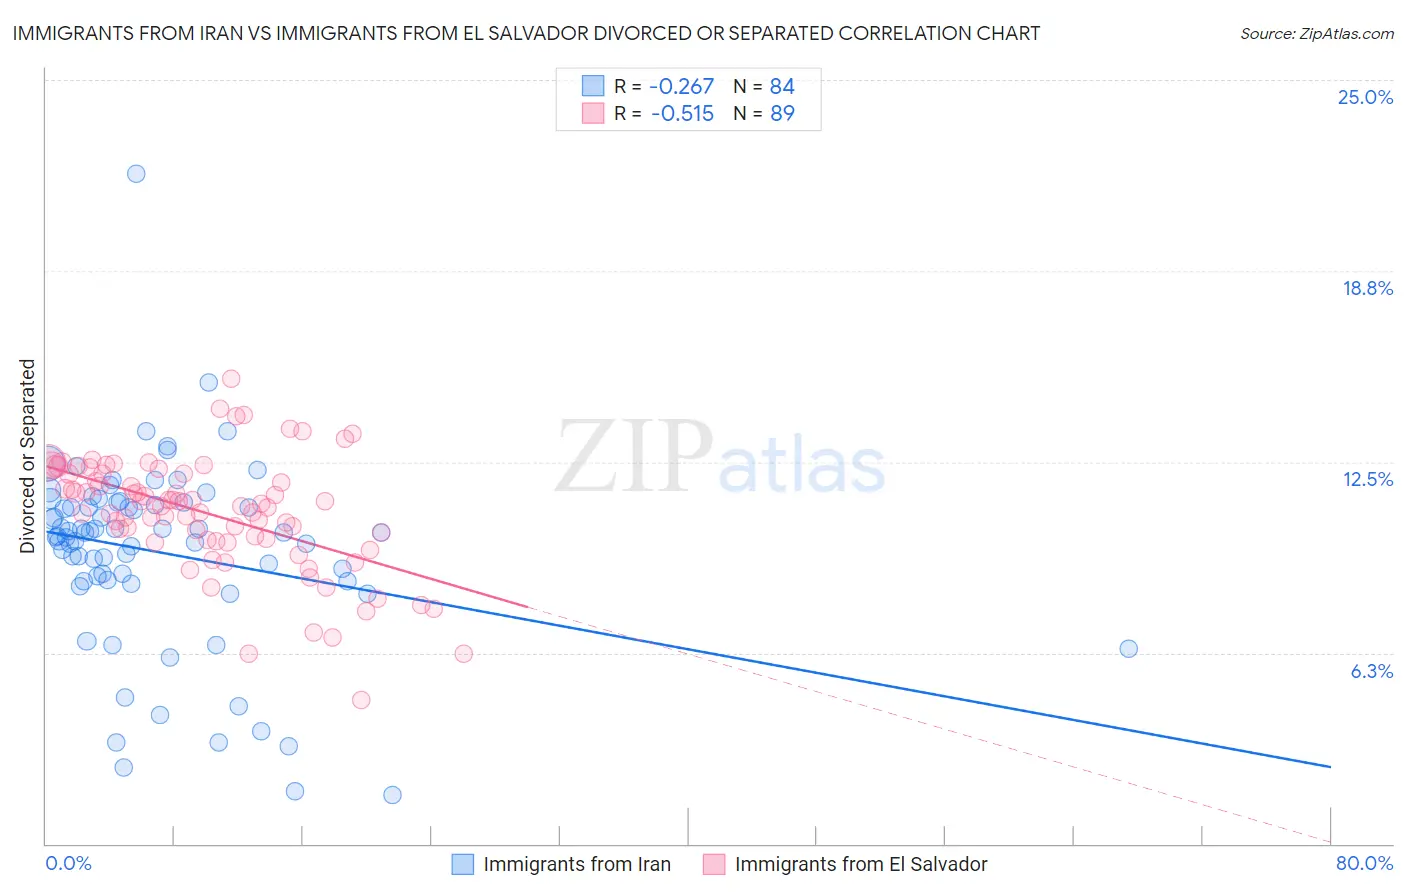
Immigrants from Iran vs Immigrants from El Salvador Divorced or Separated Correlation Chart
The statistical analysis conducted on geographies consisting of 279,868,346 people shows a weak negative correlation between the proportion of Immigrants from Iran and percentage of population currently divorced or separated in the United States with a correlation coefficient (R) of -0.267 and weighted average of 10.6%. Similarly, the statistical analysis conducted on geographies consisting of 357,792,924 people shows a substantial negative correlation between the proportion of Immigrants from El Salvador and percentage of population currently divorced or separated in the United States with a correlation coefficient (R) of -0.515 and weighted average of 11.7%, a difference of 9.6%.
Divorced or Separated Correlation Summary
| Measurement | Immigrants from Iran | Immigrants from El Salvador |
| Minimum | 1.6% | 4.7% |
| Maximum | 21.9% | 15.2% |
| Range | 20.3% | 10.5% |
| Mean | 9.5% | 10.8% |
| Median | 10.1% | 11.1% |
| Interquartile 25% (IQ1) | 8.6% | 9.9% |
| Interquartile 75% (IQ3) | 11.1% | 12.1% |
| Interquartile Range (IQR) | 2.5% | 2.2% |
| Standard Deviation (Sample) | 3.1% | 1.9% |
| Standard Deviation (Population) | 3.1% | 1.9% |
Similar Demographics by Divorced or Separated
Demographics Similar to Immigrants from Iran by Divorced or Separated
In terms of divorced or separated, the demographic groups most similar to Immigrants from Iran are Asian (10.6%, a difference of 0.0%), Immigrants from Israel (10.6%, a difference of 0.090%), Immigrants from Korea (10.6%, a difference of 0.19%), Immigrants from Armenia (10.6%, a difference of 0.63%), and Assyrian/Chaldean/Syriac (10.6%, a difference of 0.70%).
| Demographics | Rating | Rank | Divorced or Separated |
| Immigrants | South Central Asia | 100.0 /100 | #11 | Exceptional 10.4% |
| Okinawans | 100.0 /100 | #12 | Exceptional 10.5% |
| Cypriots | 100.0 /100 | #13 | Exceptional 10.5% |
| Assyrians/Chaldeans/Syriacs | 100.0 /100 | #14 | Exceptional 10.6% |
| Immigrants | Armenia | 100.0 /100 | #15 | Exceptional 10.6% |
| Immigrants | Korea | 100.0 /100 | #16 | Exceptional 10.6% |
| Immigrants | Israel | 100.0 /100 | #17 | Exceptional 10.6% |
| Immigrants | Iran | 100.0 /100 | #18 | Exceptional 10.6% |
| Asians | 100.0 /100 | #19 | Exceptional 10.6% |
| Burmese | 100.0 /100 | #20 | Exceptional 10.7% |
| Immigrants | Asia | 100.0 /100 | #21 | Exceptional 10.7% |
| Vietnamese | 100.0 /100 | #22 | Exceptional 10.8% |
| Immigrants | Pakistan | 100.0 /100 | #23 | Exceptional 10.8% |
| Immigrants | Sri Lanka | 100.0 /100 | #24 | Exceptional 10.8% |
| Iranians | 100.0 /100 | #25 | Exceptional 10.8% |
Demographics Similar to Immigrants from El Salvador by Divorced or Separated
In terms of divorced or separated, the demographic groups most similar to Immigrants from El Salvador are Immigrants from Kazakhstan (11.7%, a difference of 0.040%), Salvadoran (11.6%, a difference of 0.12%), Maltese (11.6%, a difference of 0.14%), Immigrants from Croatia (11.6%, a difference of 0.18%), and Native Hawaiian (11.7%, a difference of 0.25%).
| Demographics | Rating | Rank | Divorced or Separated |
| Immigrants | Jordan | 98.6 /100 | #98 | Exceptional 11.6% |
| Immigrants | Sweden | 98.6 /100 | #99 | Exceptional 11.6% |
| Immigrants | Northern Europe | 98.6 /100 | #100 | Exceptional 11.6% |
| Immigrants | Guyana | 98.5 /100 | #101 | Exceptional 11.6% |
| Immigrants | Croatia | 98.3 /100 | #102 | Exceptional 11.6% |
| Maltese | 98.2 /100 | #103 | Exceptional 11.6% |
| Salvadorans | 98.2 /100 | #104 | Exceptional 11.6% |
| Immigrants | El Salvador | 97.9 /100 | #105 | Exceptional 11.7% |
| Immigrants | Kazakhstan | 97.8 /100 | #106 | Exceptional 11.7% |
| Native Hawaiians | 97.2 /100 | #107 | Exceptional 11.7% |
| Greeks | 96.9 /100 | #108 | Exceptional 11.7% |
| Immigrants | South Africa | 96.9 /100 | #109 | Exceptional 11.7% |
| Immigrants | Czechoslovakia | 96.9 /100 | #110 | Exceptional 11.7% |
| Immigrants | Spain | 96.8 /100 | #111 | Exceptional 11.7% |
| Immigrants | France | 96.6 /100 | #112 | Exceptional 11.7% |