Immigrants from Hungary vs Immigrants from North America Family Households with Children
COMPARE
Immigrants from Hungary
Immigrants from North America
Family Households with Children
Family Households with Children Comparison
Immigrants from Hungary
Immigrants from North America
26.7%
FAMILY HOUSEHOLDS WITH CHILDREN
0.6/ 100
METRIC RATING
273rd/ 347
METRIC RANK
26.6%
FAMILY HOUSEHOLDS WITH CHILDREN
0.3/ 100
METRIC RATING
283rd/ 347
METRIC RANK
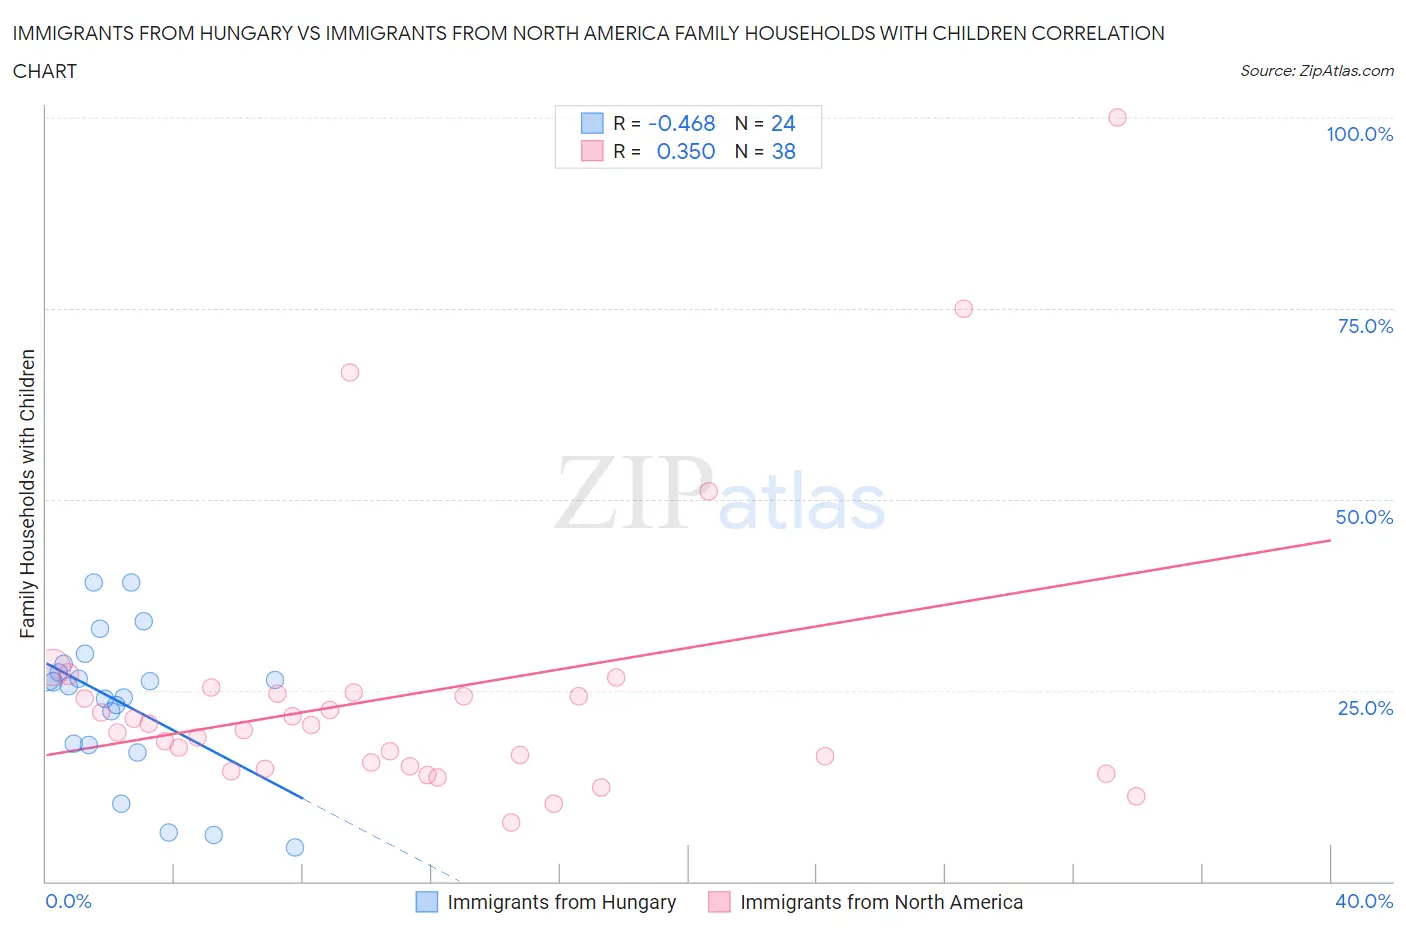
Immigrants from Hungary vs Immigrants from North America Family Households with Children Correlation Chart
The statistical analysis conducted on geographies consisting of 195,566,845 people shows a moderate negative correlation between the proportion of Immigrants from Hungary and percentage of family households with children in the United States with a correlation coefficient (R) of -0.468 and weighted average of 26.7%. Similarly, the statistical analysis conducted on geographies consisting of 461,965,747 people shows a mild positive correlation between the proportion of Immigrants from North America and percentage of family households with children in the United States with a correlation coefficient (R) of 0.350 and weighted average of 26.6%, a difference of 0.48%.
Family Households with Children Correlation Summary
| Measurement | Immigrants from Hungary | Immigrants from North America |
| Minimum | 4.4% | 7.6% |
| Maximum | 39.1% | 100.0% |
| Range | 34.7% | 92.4% |
| Mean | 23.4% | 24.6% |
| Median | 25.8% | 20.1% |
| Interquartile 25% (IQ1) | 17.9% | 15.0% |
| Interquartile 75% (IQ3) | 27.9% | 24.6% |
| Interquartile Range (IQR) | 10.0% | 9.6% |
| Standard Deviation (Sample) | 9.5% | 18.5% |
| Standard Deviation (Population) | 9.3% | 18.3% |
Demographics Similar to Immigrants from Hungary and Immigrants from North America by Family Households with Children
In terms of family households with children, the demographic groups most similar to Immigrants from Hungary are Eastern European (26.7%, a difference of 0.0%), Somali (26.7%, a difference of 0.030%), Immigrants from Northern Europe (26.7%, a difference of 0.090%), French (26.7%, a difference of 0.10%), and Immigrants from Zaire (26.7%, a difference of 0.11%). Similarly, the demographic groups most similar to Immigrants from North America are Immigrants from Canada (26.5%, a difference of 0.020%), Cambodian (26.5%, a difference of 0.050%), French American Indian (26.6%, a difference of 0.070%), Lithuanian (26.6%, a difference of 0.080%), and Immigrants from Senegal (26.5%, a difference of 0.10%).
| Demographics | Rating | Rank | Family Households with Children |
| Immigrants | Belgium | 0.9 /100 | #268 | Tragic 26.7% |
| Immigrants | Denmark | 0.8 /100 | #269 | Tragic 26.7% |
| Immigrants | Zaire | 0.7 /100 | #270 | Tragic 26.7% |
| French | 0.7 /100 | #271 | Tragic 26.7% |
| Somalis | 0.7 /100 | #272 | Tragic 26.7% |
| Immigrants | Hungary | 0.6 /100 | #273 | Tragic 26.7% |
| Eastern Europeans | 0.6 /100 | #274 | Tragic 26.7% |
| Immigrants | Northern Europe | 0.5 /100 | #275 | Tragic 26.7% |
| Immigrants | Spain | 0.5 /100 | #276 | Tragic 26.6% |
| Celtics | 0.4 /100 | #277 | Tragic 26.6% |
| Immigrants | Europe | 0.4 /100 | #278 | Tragic 26.6% |
| Finns | 0.4 /100 | #279 | Tragic 26.6% |
| Senegalese | 0.4 /100 | #280 | Tragic 26.6% |
| Lithuanians | 0.3 /100 | #281 | Tragic 26.6% |
| French American Indians | 0.3 /100 | #282 | Tragic 26.6% |
| Immigrants | North America | 0.3 /100 | #283 | Tragic 26.6% |
| Immigrants | Canada | 0.3 /100 | #284 | Tragic 26.5% |
| Cambodians | 0.2 /100 | #285 | Tragic 26.5% |
| Immigrants | Senegal | 0.2 /100 | #286 | Tragic 26.5% |
| Shoshone | 0.2 /100 | #287 | Tragic 26.5% |
| Russians | 0.2 /100 | #288 | Tragic 26.5% |