Immigrants from Congo vs Puget Sound Salish Family Households with Children
COMPARE
Immigrants from Congo
Puget Sound Salish
Family Households with Children
Family Households with Children Comparison
Immigrants from Congo
Puget Sound Salish
27.3%
FAMILY HOUSEHOLDS WITH CHILDREN
28.7/ 100
METRIC RATING
200th/ 347
METRIC RANK
27.4%
FAMILY HOUSEHOLDS WITH CHILDREN
46.2/ 100
METRIC RATING
182nd/ 347
METRIC RANK
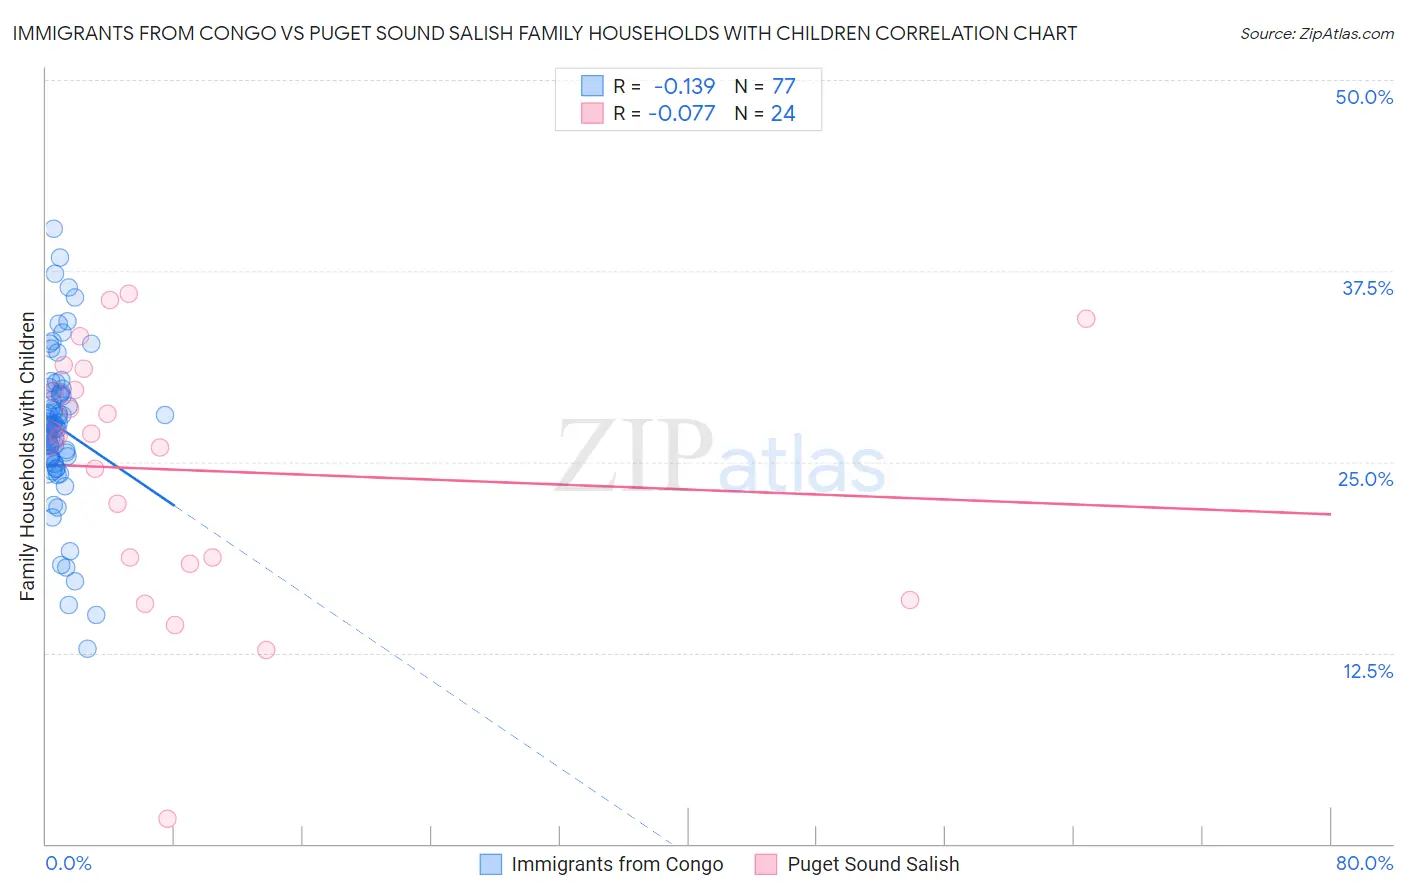
Immigrants from Congo vs Puget Sound Salish Family Households with Children Correlation Chart
The statistical analysis conducted on geographies consisting of 92,083,447 people shows a poor negative correlation between the proportion of Immigrants from Congo and percentage of family households with children in the United States with a correlation coefficient (R) of -0.139 and weighted average of 27.3%. Similarly, the statistical analysis conducted on geographies consisting of 46,155,538 people shows a slight negative correlation between the proportion of Puget Sound Salish and percentage of family households with children in the United States with a correlation coefficient (R) of -0.077 and weighted average of 27.4%, a difference of 0.42%.
Family Households with Children Correlation Summary
| Measurement | Immigrants from Congo | Puget Sound Salish |
| Minimum | 12.8% | 1.6% |
| Maximum | 40.2% | 36.0% |
| Range | 27.4% | 34.3% |
| Mean | 27.3% | 24.4% |
| Median | 27.3% | 26.7% |
| Interquartile 25% (IQ1) | 25.2% | 18.5% |
| Interquartile 75% (IQ3) | 29.6% | 30.4% |
| Interquartile Range (IQR) | 4.4% | 11.9% |
| Standard Deviation (Sample) | 5.0% | 8.5% |
| Standard Deviation (Population) | 5.0% | 8.3% |
Demographics Similar to Immigrants from Congo and Puget Sound Salish by Family Households with Children
In terms of family households with children, the demographic groups most similar to Immigrants from Congo are English (27.3%, a difference of 0.090%), Bhutanese (27.3%, a difference of 0.10%), Immigrants from Romania (27.4%, a difference of 0.15%), Cheyenne (27.4%, a difference of 0.16%), and Norwegian (27.4%, a difference of 0.16%). Similarly, the demographic groups most similar to Puget Sound Salish are Aleut (27.4%, a difference of 0.010%), South African (27.4%, a difference of 0.030%), Native Hawaiian (27.4%, a difference of 0.040%), Delaware (27.4%, a difference of 0.090%), and Immigrants from Brazil (27.4%, a difference of 0.13%).
| Demographics | Rating | Rank | Family Households with Children |
| Aleuts | 46.7 /100 | #181 | Average 27.4% |
| Puget Sound Salish | 46.2 /100 | #182 | Average 27.4% |
| South Africans | 44.9 /100 | #183 | Average 27.4% |
| Native Hawaiians | 44.6 /100 | #184 | Average 27.4% |
| Delaware | 42.0 /100 | #185 | Average 27.4% |
| Immigrants | Brazil | 40.6 /100 | #186 | Average 27.4% |
| Creek | 39.8 /100 | #187 | Fair 27.4% |
| Dutch | 38.8 /100 | #188 | Fair 27.4% |
| Immigrants | Israel | 37.9 /100 | #189 | Fair 27.4% |
| Immigrants | Uruguay | 37.7 /100 | #190 | Fair 27.4% |
| Sudanese | 37.6 /100 | #191 | Fair 27.4% |
| Pennsylvania Germans | 37.5 /100 | #192 | Fair 27.4% |
| Swedes | 36.9 /100 | #193 | Fair 27.4% |
| Immigrants | Iran | 36.1 /100 | #194 | Fair 27.4% |
| Crow | 35.7 /100 | #195 | Fair 27.4% |
| Cheyenne | 35.1 /100 | #196 | Fair 27.4% |
| Norwegians | 35.0 /100 | #197 | Fair 27.4% |
| Immigrants | Romania | 34.4 /100 | #198 | Fair 27.4% |
| English | 32.0 /100 | #199 | Fair 27.3% |
| Immigrants | Congo | 28.7 /100 | #200 | Fair 27.3% |
| Bhutanese | 25.1 /100 | #201 | Fair 27.3% |