Immigrants from Hong Kong vs British Births to Unmarried Women
COMPARE
Immigrants from Hong Kong
British
Births to Unmarried Women
Births to Unmarried Women Comparison
Immigrants from Hong Kong
British
23.6%
BIRTHS TO UNMARRIED WOMEN
100.0/ 100
METRIC RATING
5th/ 347
METRIC RANK
30.8%
BIRTHS TO UNMARRIED WOMEN
76.0/ 100
METRIC RATING
153rd/ 347
METRIC RANK
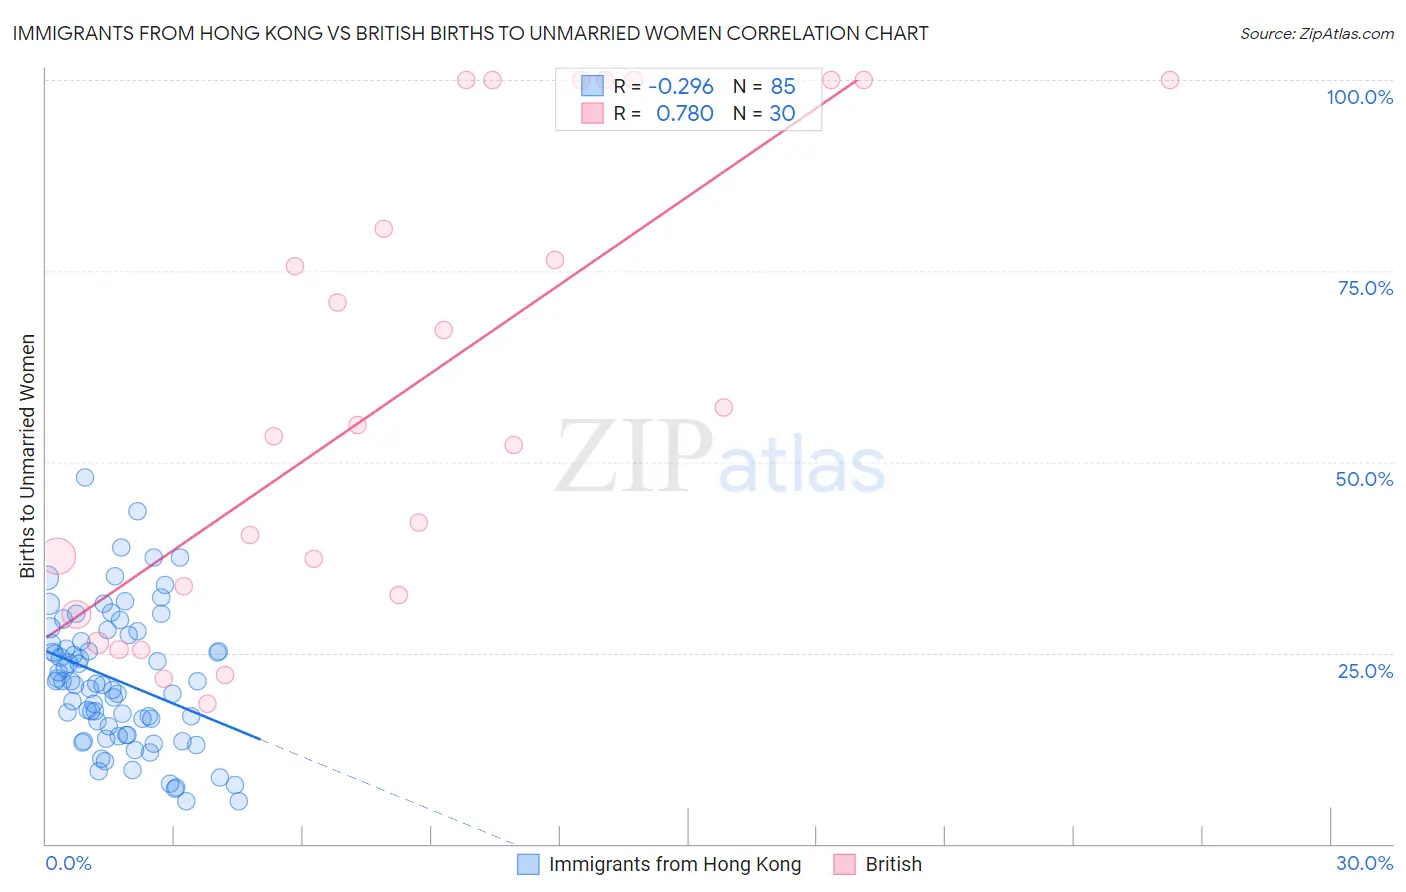
Immigrants from Hong Kong vs British Births to Unmarried Women Correlation Chart
The statistical analysis conducted on geographies consisting of 239,354,992 people shows a weak negative correlation between the proportion of Immigrants from Hong Kong and percentage of births to unmarried women in the United States with a correlation coefficient (R) of -0.296 and weighted average of 23.6%. Similarly, the statistical analysis conducted on geographies consisting of 478,658,023 people shows a strong positive correlation between the proportion of British and percentage of births to unmarried women in the United States with a correlation coefficient (R) of 0.780 and weighted average of 30.8%, a difference of 30.7%.
Births to Unmarried Women Correlation Summary
| Measurement | Immigrants from Hong Kong | British |
| Minimum | 5.6% | 18.3% |
| Maximum | 48.0% | 100.0% |
| Range | 42.4% | 81.7% |
| Mean | 21.4% | 59.4% |
| Median | 21.0% | 54.1% |
| Interquartile 25% (IQ1) | 14.3% | 32.5% |
| Interquartile 75% (IQ3) | 26.9% | 100.0% |
| Interquartile Range (IQR) | 12.6% | 67.5% |
| Standard Deviation (Sample) | 8.9% | 30.1% |
| Standard Deviation (Population) | 8.8% | 29.6% |
Similar Demographics by Births to Unmarried Women
Demographics Similar to Immigrants from Hong Kong by Births to Unmarried Women
In terms of births to unmarried women, the demographic groups most similar to Immigrants from Hong Kong are Immigrants from Iran (24.0%, a difference of 1.6%), Thai (24.0%, a difference of 1.9%), Immigrants from Taiwan (23.0%, a difference of 2.5%), Filipino (23.0%, a difference of 2.6%), and Immigrants from India (22.9%, a difference of 3.0%).
| Demographics | Rating | Rank | Births to Unmarried Women |
| Assyrians/Chaldeans/Syriacs | 100.0 /100 | #1 | Exceptional 22.0% |
| Immigrants | India | 100.0 /100 | #2 | Exceptional 22.9% |
| Filipinos | 100.0 /100 | #3 | Exceptional 23.0% |
| Immigrants | Taiwan | 100.0 /100 | #4 | Exceptional 23.0% |
| Immigrants | Hong Kong | 100.0 /100 | #5 | Exceptional 23.6% |
| Immigrants | Iran | 100.0 /100 | #6 | Exceptional 24.0% |
| Thais | 100.0 /100 | #7 | Exceptional 24.0% |
| Immigrants | China | 100.0 /100 | #8 | Exceptional 24.7% |
| Immigrants | South Central Asia | 100.0 /100 | #9 | Exceptional 24.7% |
| Immigrants | Eastern Asia | 100.0 /100 | #10 | Exceptional 25.0% |
| Immigrants | Israel | 100.0 /100 | #11 | Exceptional 25.1% |
| Indians (Asian) | 100.0 /100 | #12 | Exceptional 25.3% |
| Iranians | 100.0 /100 | #13 | Exceptional 25.3% |
| Immigrants | Lebanon | 100.0 /100 | #14 | Exceptional 25.3% |
| Immigrants | Singapore | 100.0 /100 | #15 | Exceptional 25.6% |
Demographics Similar to British by Births to Unmarried Women
In terms of births to unmarried women, the demographic groups most similar to British are Polish (30.8%, a difference of 0.020%), Yugoslavian (30.8%, a difference of 0.12%), Italian (30.8%, a difference of 0.13%), Somali (30.7%, a difference of 0.24%), and Immigrants from Bangladesh (30.9%, a difference of 0.27%).
| Demographics | Rating | Rank | Births to Unmarried Women |
| Northern Europeans | 81.4 /100 | #146 | Excellent 30.6% |
| Immigrants | Oceania | 81.2 /100 | #147 | Excellent 30.6% |
| Chileans | 79.1 /100 | #148 | Good 30.7% |
| Serbians | 78.8 /100 | #149 | Good 30.7% |
| Somalis | 77.8 /100 | #150 | Good 30.7% |
| Italians | 77.0 /100 | #151 | Good 30.8% |
| Poles | 76.2 /100 | #152 | Good 30.8% |
| British | 76.0 /100 | #153 | Good 30.8% |
| Yugoslavians | 75.1 /100 | #154 | Good 30.8% |
| Immigrants | Bangladesh | 73.9 /100 | #155 | Good 30.9% |
| Carpatho Rusyns | 73.5 /100 | #156 | Good 30.9% |
| Immigrants | Eastern Africa | 72.1 /100 | #157 | Good 31.0% |
| Austrians | 69.9 /100 | #158 | Good 31.0% |
| Immigrants | England | 69.4 /100 | #159 | Good 31.1% |
| Immigrants | Western Europe | 69.3 /100 | #160 | Good 31.1% |