Okinawan vs Mexican American Indian Births to Unmarried Women
COMPARE
Okinawan
Mexican American Indian
Births to Unmarried Women
Births to Unmarried Women Comparison
Okinawans
Mexican American Indians
26.9%
BIRTHS TO UNMARRIED WOMEN
99.8/ 100
METRIC RATING
28th/ 347
METRIC RANK
35.7%
BIRTHS TO UNMARRIED WOMEN
0.4/ 100
METRIC RATING
250th/ 347
METRIC RANK
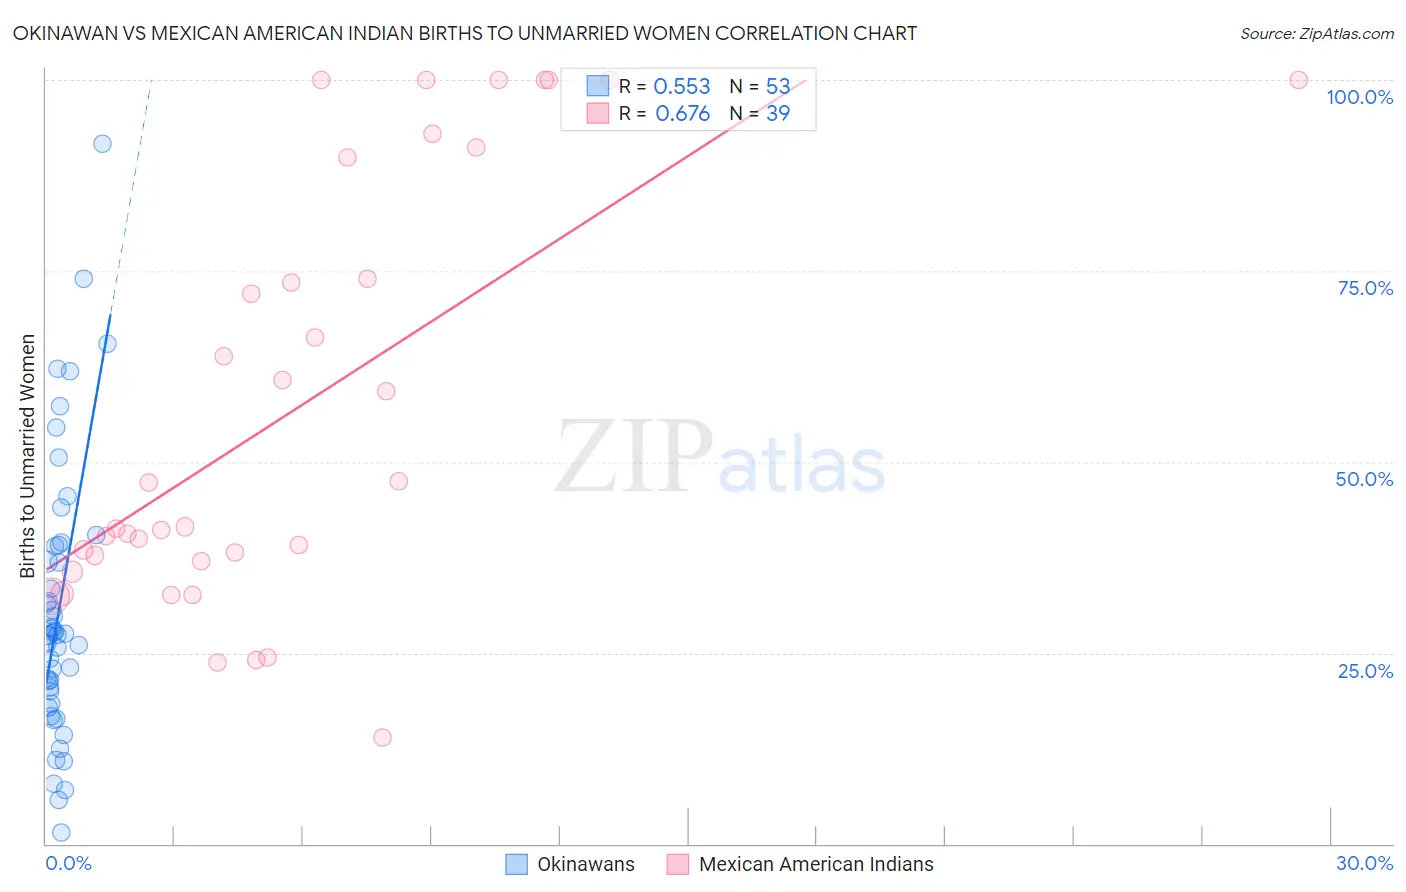
Okinawan vs Mexican American Indian Births to Unmarried Women Correlation Chart
The statistical analysis conducted on geographies consisting of 71,741,584 people shows a substantial positive correlation between the proportion of Okinawans and percentage of births to unmarried women in the United States with a correlation coefficient (R) of 0.553 and weighted average of 26.9%. Similarly, the statistical analysis conducted on geographies consisting of 305,475,949 people shows a significant positive correlation between the proportion of Mexican American Indians and percentage of births to unmarried women in the United States with a correlation coefficient (R) of 0.676 and weighted average of 35.7%, a difference of 32.8%.
Births to Unmarried Women Correlation Summary
| Measurement | Okinawan | Mexican American Indian |
| Minimum | 1.4% | 13.9% |
| Maximum | 91.7% | 100.0% |
| Range | 90.3% | 86.1% |
| Mean | 30.7% | 57.1% |
| Median | 27.4% | 41.5% |
| Interquartile 25% (IQ1) | 19.2% | 36.9% |
| Interquartile 75% (IQ3) | 39.0% | 89.8% |
| Interquartile Range (IQR) | 19.9% | 52.9% |
| Standard Deviation (Sample) | 18.0% | 27.6% |
| Standard Deviation (Population) | 17.8% | 27.2% |
Similar Demographics by Births to Unmarried Women
Demographics Similar to Okinawans by Births to Unmarried Women
In terms of births to unmarried women, the demographic groups most similar to Okinawans are Cypriot (27.0%, a difference of 0.36%), Immigrants from Asia (26.8%, a difference of 0.51%), Asian (26.8%, a difference of 0.52%), Bulgarian (27.1%, a difference of 0.52%), and Immigrants from Iraq (27.1%, a difference of 0.81%).
| Demographics | Rating | Rank | Births to Unmarried Women |
| Soviet Union | 99.9 /100 | #21 | Exceptional 26.3% |
| Burmese | 99.9 /100 | #22 | Exceptional 26.4% |
| Immigrants | Japan | 99.9 /100 | #23 | Exceptional 26.4% |
| Immigrants | Australia | 99.9 /100 | #24 | Exceptional 26.6% |
| Cambodians | 99.9 /100 | #25 | Exceptional 26.7% |
| Asians | 99.9 /100 | #26 | Exceptional 26.8% |
| Immigrants | Asia | 99.9 /100 | #27 | Exceptional 26.8% |
| Okinawans | 99.8 /100 | #28 | Exceptional 26.9% |
| Cypriots | 99.8 /100 | #29 | Exceptional 27.0% |
| Bulgarians | 99.8 /100 | #30 | Exceptional 27.1% |
| Immigrants | Iraq | 99.8 /100 | #31 | Exceptional 27.1% |
| Immigrants | Russia | 99.8 /100 | #32 | Exceptional 27.1% |
| Immigrants | Sri Lanka | 99.8 /100 | #33 | Exceptional 27.2% |
| Immigrants | Pakistan | 99.8 /100 | #34 | Exceptional 27.2% |
| Immigrants | Ireland | 99.7 /100 | #35 | Exceptional 27.2% |
Demographics Similar to Mexican American Indians by Births to Unmarried Women
In terms of births to unmarried women, the demographic groups most similar to Mexican American Indians are Immigrants from Western Africa (36.0%, a difference of 0.57%), Bermudan (35.5%, a difference of 0.61%), Nonimmigrants (35.5%, a difference of 0.62%), Salvadoran (36.0%, a difference of 0.69%), and Immigrants from Nigeria (35.4%, a difference of 0.96%).
| Demographics | Rating | Rank | Births to Unmarried Women |
| Japanese | 0.9 /100 | #243 | Tragic 35.2% |
| Guyanese | 0.9 /100 | #244 | Tragic 35.2% |
| Shoshone | 0.8 /100 | #245 | Tragic 35.3% |
| Nigerians | 0.7 /100 | #246 | Tragic 35.3% |
| Immigrants | Nigeria | 0.7 /100 | #247 | Tragic 35.4% |
| Immigrants | Nonimmigrants | 0.6 /100 | #248 | Tragic 35.5% |
| Bermudans | 0.6 /100 | #249 | Tragic 35.5% |
| Mexican American Indians | 0.4 /100 | #250 | Tragic 35.7% |
| Immigrants | Western Africa | 0.3 /100 | #251 | Tragic 36.0% |
| Salvadorans | 0.3 /100 | #252 | Tragic 36.0% |
| Immigrants | Portugal | 0.2 /100 | #253 | Tragic 36.2% |
| Potawatomi | 0.2 /100 | #254 | Tragic 36.2% |
| Chickasaw | 0.2 /100 | #255 | Tragic 36.3% |
| Immigrants | Trinidad and Tobago | 0.2 /100 | #256 | Tragic 36.3% |
| Immigrants | Grenada | 0.2 /100 | #257 | Tragic 36.3% |