Immigrants from Hong Kong vs Afghan Vision Disability
COMPARE
Immigrants from Hong Kong
Afghan
Vision Disability
Vision Disability Comparison
Immigrants from Hong Kong
Afghans
1.8%
VISION DISABILITY
100.0/ 100
METRIC RATING
10th/ 347
METRIC RANK
2.0%
VISION DISABILITY
99.5/ 100
METRIC RATING
50th/ 347
METRIC RANK
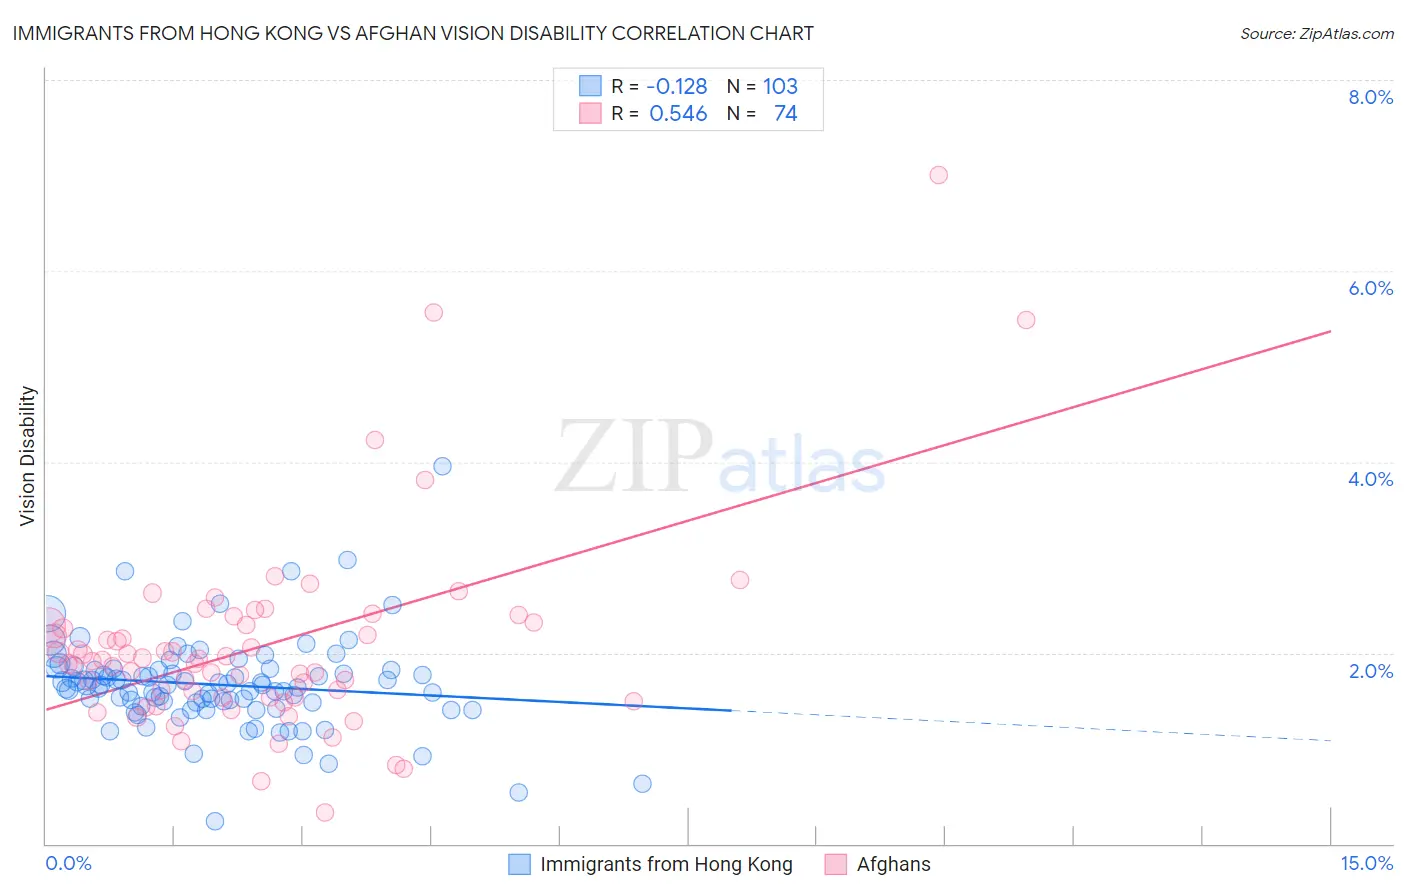
Immigrants from Hong Kong vs Afghan Vision Disability Correlation Chart
The statistical analysis conducted on geographies consisting of 253,892,306 people shows a poor negative correlation between the proportion of Immigrants from Hong Kong and percentage of population with vision disability in the United States with a correlation coefficient (R) of -0.128 and weighted average of 1.8%. Similarly, the statistical analysis conducted on geographies consisting of 148,842,568 people shows a substantial positive correlation between the proportion of Afghans and percentage of population with vision disability in the United States with a correlation coefficient (R) of 0.546 and weighted average of 2.0%, a difference of 10.0%.
Vision Disability Correlation Summary
| Measurement | Immigrants from Hong Kong | Afghan |
| Minimum | 0.24% | 0.32% |
| Maximum | 4.0% | 7.0% |
| Range | 3.7% | 6.7% |
| Mean | 1.7% | 2.1% |
| Median | 1.7% | 1.9% |
| Interquartile 25% (IQ1) | 1.5% | 1.5% |
| Interquartile 75% (IQ3) | 1.8% | 2.3% |
| Interquartile Range (IQR) | 0.35% | 0.76% |
| Standard Deviation (Sample) | 0.48% | 1.0% |
| Standard Deviation (Population) | 0.48% | 1.0% |
Similar Demographics by Vision Disability
Demographics Similar to Immigrants from Hong Kong by Vision Disability
In terms of vision disability, the demographic groups most similar to Immigrants from Hong Kong are Immigrants from Singapore (1.8%, a difference of 0.19%), Iranian (1.8%, a difference of 0.93%), Immigrants from South Central Asia (1.8%, a difference of 1.1%), Immigrants from Israel (1.8%, a difference of 1.1%), and Immigrants from Iran (1.8%, a difference of 1.1%).
| Demographics | Rating | Rank | Vision Disability |
| Immigrants | Taiwan | 100.0 /100 | #3 | Exceptional 1.7% |
| Thais | 100.0 /100 | #4 | Exceptional 1.7% |
| Okinawans | 100.0 /100 | #5 | Exceptional 1.8% |
| Immigrants | Iran | 100.0 /100 | #6 | Exceptional 1.8% |
| Immigrants | South Central Asia | 100.0 /100 | #7 | Exceptional 1.8% |
| Iranians | 100.0 /100 | #8 | Exceptional 1.8% |
| Immigrants | Singapore | 100.0 /100 | #9 | Exceptional 1.8% |
| Immigrants | Hong Kong | 100.0 /100 | #10 | Exceptional 1.8% |
| Immigrants | Israel | 100.0 /100 | #11 | Exceptional 1.8% |
| Immigrants | Korea | 100.0 /100 | #12 | Exceptional 1.8% |
| Immigrants | Eastern Asia | 100.0 /100 | #13 | Exceptional 1.8% |
| Immigrants | China | 100.0 /100 | #14 | Exceptional 1.8% |
| Immigrants | Bolivia | 100.0 /100 | #15 | Exceptional 1.8% |
| Indians (Asian) | 100.0 /100 | #16 | Exceptional 1.8% |
| Burmese | 100.0 /100 | #17 | Exceptional 1.8% |
Demographics Similar to Afghans by Vision Disability
In terms of vision disability, the demographic groups most similar to Afghans are Latvian (2.0%, a difference of 0.060%), Tongan (2.0%, a difference of 0.090%), Israeli (2.0%, a difference of 0.13%), Immigrants from Serbia (2.0%, a difference of 0.40%), and Immigrants from Belarus (2.0%, a difference of 0.51%).
| Demographics | Rating | Rank | Vision Disability |
| Eastern Europeans | 99.7 /100 | #43 | Exceptional 2.0% |
| Immigrants | Indonesia | 99.7 /100 | #44 | Exceptional 2.0% |
| Ethiopians | 99.7 /100 | #45 | Exceptional 2.0% |
| Immigrants | Sweden | 99.7 /100 | #46 | Exceptional 2.0% |
| Immigrants | Bulgaria | 99.7 /100 | #47 | Exceptional 2.0% |
| Israelis | 99.6 /100 | #48 | Exceptional 2.0% |
| Latvians | 99.5 /100 | #49 | Exceptional 2.0% |
| Afghans | 99.5 /100 | #50 | Exceptional 2.0% |
| Tongans | 99.5 /100 | #51 | Exceptional 2.0% |
| Immigrants | Serbia | 99.4 /100 | #52 | Exceptional 2.0% |
| Immigrants | Belarus | 99.3 /100 | #53 | Exceptional 2.0% |
| Macedonians | 99.3 /100 | #54 | Exceptional 2.0% |
| Laotians | 99.3 /100 | #55 | Exceptional 2.0% |
| Jordanians | 99.2 /100 | #56 | Exceptional 2.0% |
| Somalis | 99.2 /100 | #57 | Exceptional 2.0% |