Immigrants from Guatemala vs Immigrants from Africa Births to Unmarried Women
COMPARE
Immigrants from Guatemala
Immigrants from Africa
Births to Unmarried Women
Births to Unmarried Women Comparison
Immigrants from Guatemala
Immigrants from Africa
37.5%
BIRTHS TO UNMARRIED WOMEN
0.0/ 100
METRIC RATING
286th/ 347
METRIC RANK
33.0%
BIRTHS TO UNMARRIED WOMEN
14.3/ 100
METRIC RATING
204th/ 347
METRIC RANK
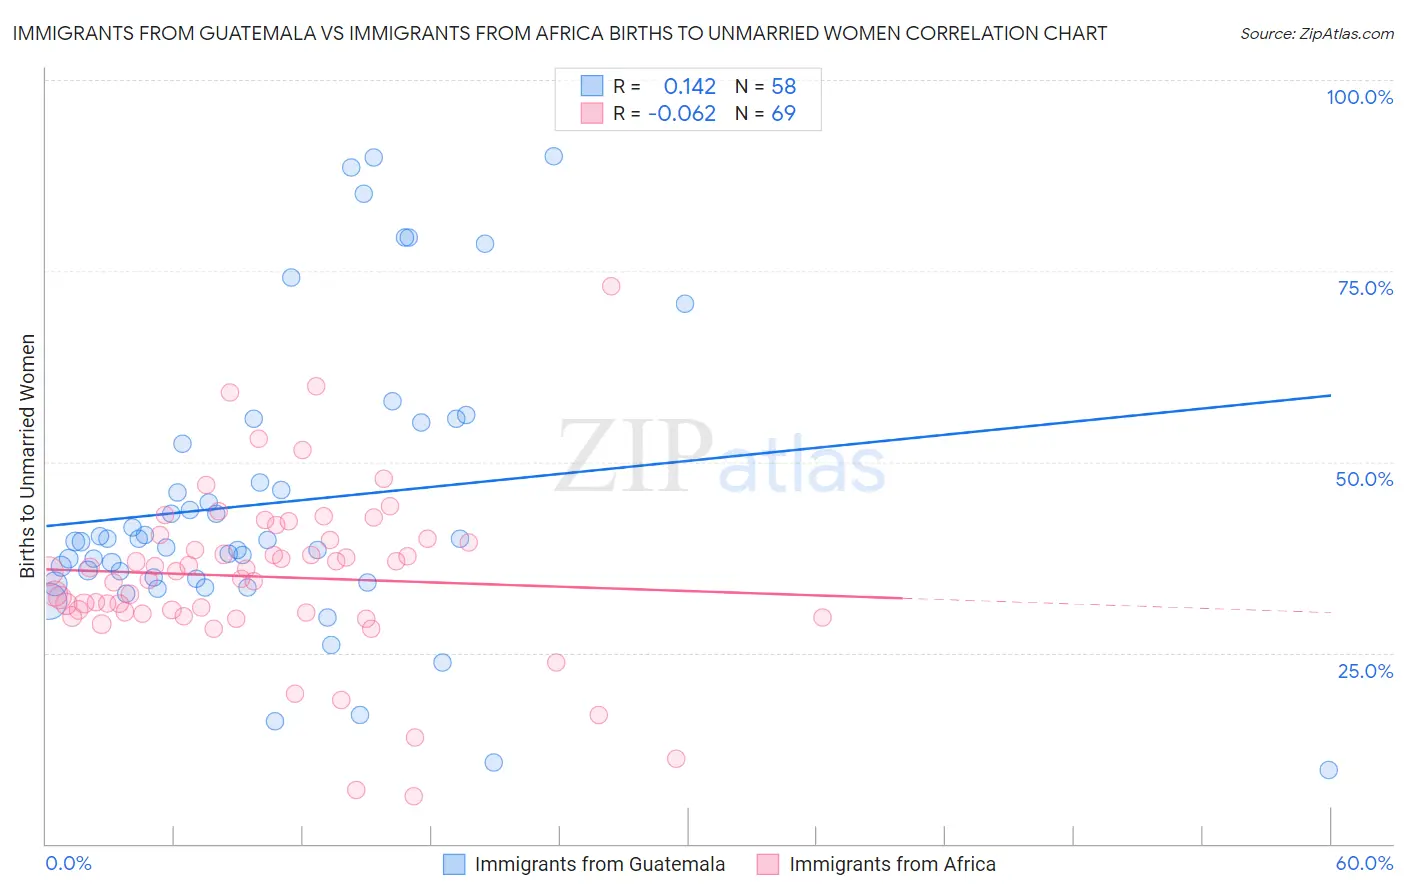
Immigrants from Guatemala vs Immigrants from Africa Births to Unmarried Women Correlation Chart
The statistical analysis conducted on geographies consisting of 358,367,687 people shows a poor positive correlation between the proportion of Immigrants from Guatemala and percentage of births to unmarried women in the United States with a correlation coefficient (R) of 0.142 and weighted average of 37.5%. Similarly, the statistical analysis conducted on geographies consisting of 434,308,086 people shows a slight negative correlation between the proportion of Immigrants from Africa and percentage of births to unmarried women in the United States with a correlation coefficient (R) of -0.062 and weighted average of 33.0%, a difference of 13.5%.
Births to Unmarried Women Correlation Summary
| Measurement | Immigrants from Guatemala | Immigrants from Africa |
| Minimum | 9.7% | 6.3% |
| Maximum | 90.0% | 73.0% |
| Range | 80.3% | 66.7% |
| Mean | 44.6% | 35.0% |
| Median | 39.6% | 35.7% |
| Interquartile 25% (IQ1) | 34.7% | 30.1% |
| Interquartile 75% (IQ3) | 52.4% | 39.8% |
| Interquartile Range (IQR) | 17.8% | 9.7% |
| Standard Deviation (Sample) | 18.9% | 11.0% |
| Standard Deviation (Population) | 18.7% | 10.9% |
Similar Demographics by Births to Unmarried Women
Demographics Similar to Immigrants from Guatemala by Births to Unmarried Women
In terms of births to unmarried women, the demographic groups most similar to Immigrants from Guatemala are Immigrants from Mexico (37.5%, a difference of 0.010%), Immigrants from Central America (37.4%, a difference of 0.11%), Spanish American Indian (37.4%, a difference of 0.18%), Creek (37.6%, a difference of 0.23%), and Liberian (37.4%, a difference of 0.26%).
| Demographics | Rating | Rank | Births to Unmarried Women |
| West Indians | 0.1 /100 | #279 | Tragic 37.3% |
| Immigrants | St. Vincent and the Grenadines | 0.1 /100 | #280 | Tragic 37.3% |
| Immigrants | Belize | 0.1 /100 | #281 | Tragic 37.3% |
| Liberians | 0.0 /100 | #282 | Tragic 37.4% |
| Spanish American Indians | 0.0 /100 | #283 | Tragic 37.4% |
| Immigrants | Central America | 0.0 /100 | #284 | Tragic 37.4% |
| Immigrants | Mexico | 0.0 /100 | #285 | Tragic 37.5% |
| Immigrants | Guatemala | 0.0 /100 | #286 | Tragic 37.5% |
| Creek | 0.0 /100 | #287 | Tragic 37.6% |
| Immigrants | Liberia | 0.0 /100 | #288 | Tragic 37.6% |
| Alaskan Athabascans | 0.0 /100 | #289 | Tragic 37.7% |
| Hispanics or Latinos | 0.0 /100 | #290 | Tragic 37.8% |
| Seminole | 0.0 /100 | #291 | Tragic 37.9% |
| Blackfeet | 0.0 /100 | #292 | Tragic 37.9% |
| Immigrants | Nicaragua | 0.0 /100 | #293 | Tragic 38.0% |
Demographics Similar to Immigrants from Africa by Births to Unmarried Women
In terms of births to unmarried women, the demographic groups most similar to Immigrants from Africa are Ute (33.0%, a difference of 0.020%), German Russian (33.1%, a difference of 0.23%), Uruguayan (33.1%, a difference of 0.29%), Immigrants from Micronesia (32.9%, a difference of 0.40%), and Immigrants from Burma/Myanmar (32.9%, a difference of 0.41%).
| Demographics | Rating | Rank | Births to Unmarried Women |
| Immigrants | Immigrants | 20.6 /100 | #197 | Fair 32.7% |
| Costa Ricans | 20.3 /100 | #198 | Fair 32.7% |
| Immigrants | Thailand | 18.9 /100 | #199 | Poor 32.8% |
| Immigrants | Germany | 18.8 /100 | #200 | Poor 32.8% |
| Immigrants | Burma/Myanmar | 16.7 /100 | #201 | Poor 32.9% |
| Immigrants | Micronesia | 16.6 /100 | #202 | Poor 32.9% |
| Ute | 14.4 /100 | #203 | Poor 33.0% |
| Immigrants | Africa | 14.3 /100 | #204 | Poor 33.0% |
| German Russians | 13.1 /100 | #205 | Poor 33.1% |
| Uruguayans | 12.8 /100 | #206 | Poor 33.1% |
| Immigrants | Sudan | 11.5 /100 | #207 | Poor 33.2% |
| Hawaiians | 11.3 /100 | #208 | Poor 33.2% |
| Whites/Caucasians | 10.7 /100 | #209 | Poor 33.3% |
| Scotch-Irish | 10.7 /100 | #210 | Poor 33.3% |
| Ecuadorians | 10.5 /100 | #211 | Poor 33.3% |