Immigrants from Guatemala vs Immigrants from Philippines Births to Unmarried Women
COMPARE
Immigrants from Guatemala
Immigrants from Philippines
Births to Unmarried Women
Births to Unmarried Women Comparison
Immigrants from Guatemala
Immigrants from Philippines
37.5%
BIRTHS TO UNMARRIED WOMEN
0.0/ 100
METRIC RATING
286th/ 347
METRIC RANK
30.4%
BIRTHS TO UNMARRIED WOMEN
83.9/ 100
METRIC RATING
137th/ 347
METRIC RANK
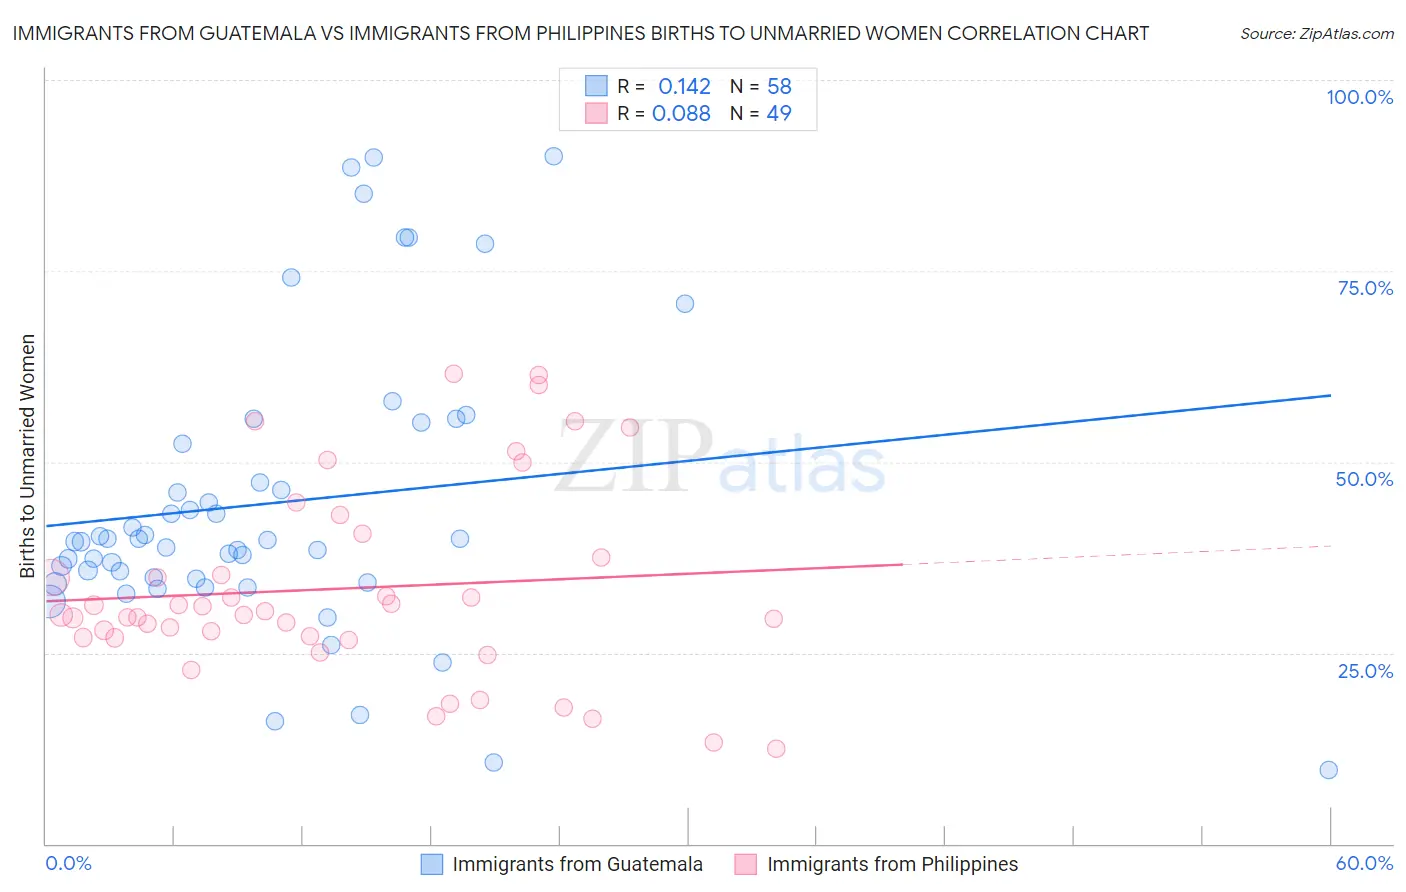
Immigrants from Guatemala vs Immigrants from Philippines Births to Unmarried Women Correlation Chart
The statistical analysis conducted on geographies consisting of 358,367,687 people shows a poor positive correlation between the proportion of Immigrants from Guatemala and percentage of births to unmarried women in the United States with a correlation coefficient (R) of 0.142 and weighted average of 37.5%. Similarly, the statistical analysis conducted on geographies consisting of 435,603,285 people shows a slight positive correlation between the proportion of Immigrants from Philippines and percentage of births to unmarried women in the United States with a correlation coefficient (R) of 0.088 and weighted average of 30.4%, a difference of 23.2%.
Births to Unmarried Women Correlation Summary
| Measurement | Immigrants from Guatemala | Immigrants from Philippines |
| Minimum | 9.7% | 12.5% |
| Maximum | 90.0% | 61.5% |
| Range | 80.3% | 49.0% |
| Mean | 44.6% | 33.4% |
| Median | 39.6% | 30.0% |
| Interquartile 25% (IQ1) | 34.7% | 27.0% |
| Interquartile 75% (IQ3) | 52.4% | 39.0% |
| Interquartile Range (IQR) | 17.8% | 12.0% |
| Standard Deviation (Sample) | 18.9% | 12.6% |
| Standard Deviation (Population) | 18.7% | 12.5% |
Similar Demographics by Births to Unmarried Women
Demographics Similar to Immigrants from Guatemala by Births to Unmarried Women
In terms of births to unmarried women, the demographic groups most similar to Immigrants from Guatemala are Immigrants from Mexico (37.5%, a difference of 0.010%), Immigrants from Central America (37.4%, a difference of 0.11%), Spanish American Indian (37.4%, a difference of 0.18%), Creek (37.6%, a difference of 0.23%), and Liberian (37.4%, a difference of 0.26%).
| Demographics | Rating | Rank | Births to Unmarried Women |
| West Indians | 0.1 /100 | #279 | Tragic 37.3% |
| Immigrants | St. Vincent and the Grenadines | 0.1 /100 | #280 | Tragic 37.3% |
| Immigrants | Belize | 0.1 /100 | #281 | Tragic 37.3% |
| Liberians | 0.0 /100 | #282 | Tragic 37.4% |
| Spanish American Indians | 0.0 /100 | #283 | Tragic 37.4% |
| Immigrants | Central America | 0.0 /100 | #284 | Tragic 37.4% |
| Immigrants | Mexico | 0.0 /100 | #285 | Tragic 37.5% |
| Immigrants | Guatemala | 0.0 /100 | #286 | Tragic 37.5% |
| Creek | 0.0 /100 | #287 | Tragic 37.6% |
| Immigrants | Liberia | 0.0 /100 | #288 | Tragic 37.6% |
| Alaskan Athabascans | 0.0 /100 | #289 | Tragic 37.7% |
| Hispanics or Latinos | 0.0 /100 | #290 | Tragic 37.8% |
| Seminole | 0.0 /100 | #291 | Tragic 37.9% |
| Blackfeet | 0.0 /100 | #292 | Tragic 37.9% |
| Immigrants | Nicaragua | 0.0 /100 | #293 | Tragic 38.0% |
Demographics Similar to Immigrants from Philippines by Births to Unmarried Women
In terms of births to unmarried women, the demographic groups most similar to Immigrants from Philippines are Puget Sound Salish (30.4%, a difference of 0.0%), Immigrants from Canada (30.4%, a difference of 0.040%), Immigrants from Scotland (30.4%, a difference of 0.13%), Swiss (30.5%, a difference of 0.14%), and Brazilian (30.4%, a difference of 0.16%).
| Demographics | Rating | Rank | Births to Unmarried Women |
| Immigrants | Bosnia and Herzegovina | 85.7 /100 | #130 | Excellent 30.3% |
| Immigrants | Zimbabwe | 85.7 /100 | #131 | Excellent 30.3% |
| New Zealanders | 85.5 /100 | #132 | Excellent 30.3% |
| Immigrants | Morocco | 85.2 /100 | #133 | Excellent 30.4% |
| Immigrants | South Eastern Asia | 85.2 /100 | #134 | Excellent 30.4% |
| Brazilians | 84.8 /100 | #135 | Excellent 30.4% |
| Immigrants | Scotland | 84.6 /100 | #136 | Excellent 30.4% |
| Immigrants | Philippines | 83.9 /100 | #137 | Excellent 30.4% |
| Puget Sound Salish | 83.9 /100 | #138 | Excellent 30.4% |
| Immigrants | Canada | 83.7 /100 | #139 | Excellent 30.4% |
| Swiss | 83.1 /100 | #140 | Excellent 30.5% |
| Pakistanis | 83.0 /100 | #141 | Excellent 30.5% |
| South Africans | 82.7 /100 | #142 | Excellent 30.5% |
| Immigrants | Uganda | 82.6 /100 | #143 | Excellent 30.5% |
| Czechs | 82.1 /100 | #144 | Excellent 30.5% |