Immigrants from Guatemala vs Lebanese Births to Unmarried Women
COMPARE
Immigrants from Guatemala
Lebanese
Births to Unmarried Women
Births to Unmarried Women Comparison
Immigrants from Guatemala
Lebanese
37.5%
BIRTHS TO UNMARRIED WOMEN
0.0/ 100
METRIC RATING
286th/ 347
METRIC RANK
29.5%
BIRTHS TO UNMARRIED WOMEN
94.4/ 100
METRIC RATING
103rd/ 347
METRIC RANK
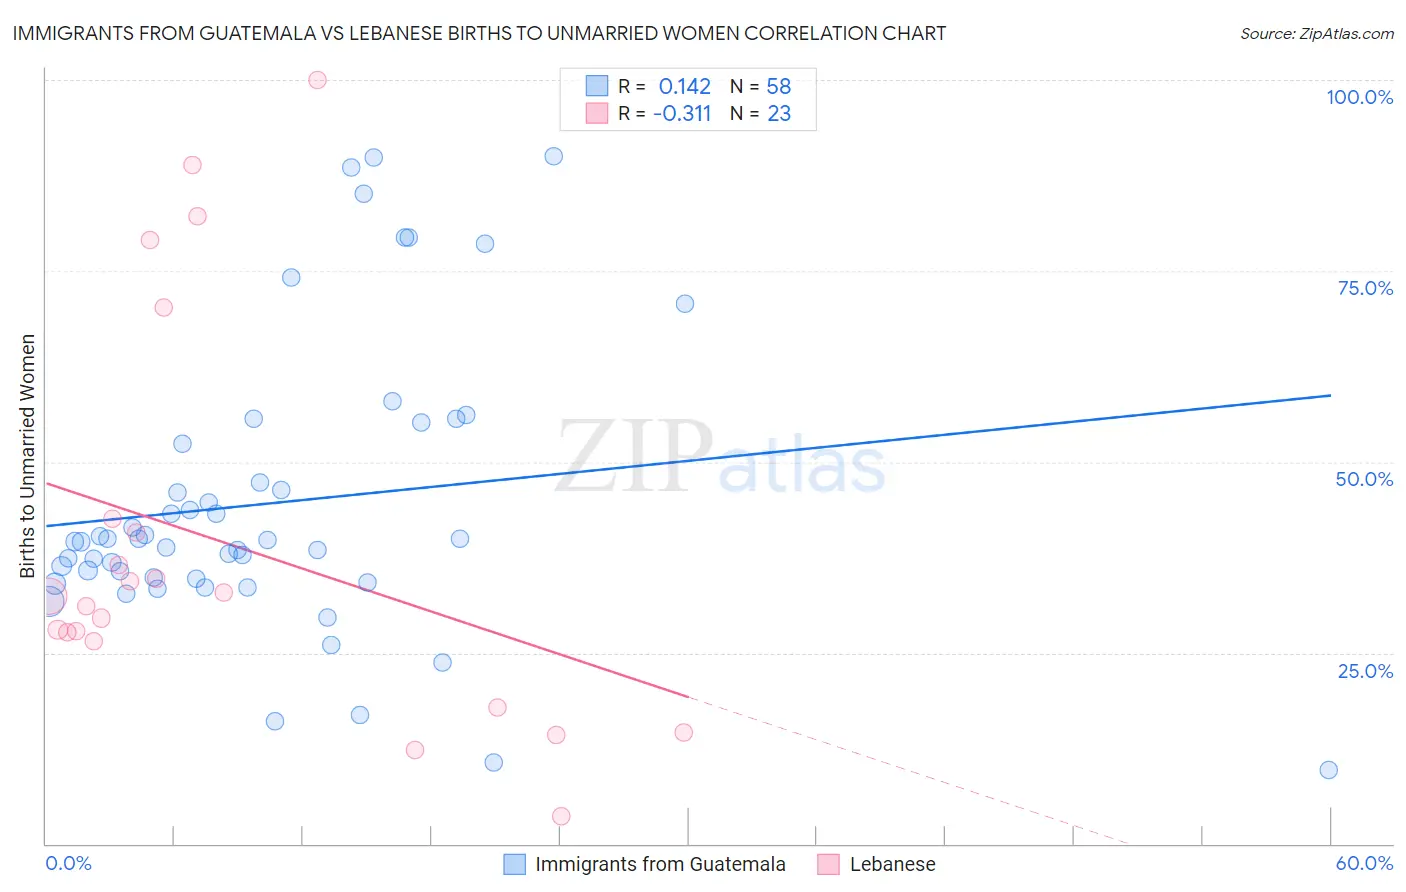
Immigrants from Guatemala vs Lebanese Births to Unmarried Women Correlation Chart
The statistical analysis conducted on geographies consisting of 358,367,687 people shows a poor positive correlation between the proportion of Immigrants from Guatemala and percentage of births to unmarried women in the United States with a correlation coefficient (R) of 0.142 and weighted average of 37.5%. Similarly, the statistical analysis conducted on geographies consisting of 372,610,698 people shows a mild negative correlation between the proportion of Lebanese and percentage of births to unmarried women in the United States with a correlation coefficient (R) of -0.311 and weighted average of 29.5%, a difference of 26.8%.
Births to Unmarried Women Correlation Summary
| Measurement | Immigrants from Guatemala | Lebanese |
| Minimum | 9.7% | 3.6% |
| Maximum | 90.0% | 100.0% |
| Range | 80.3% | 96.4% |
| Mean | 44.6% | 39.5% |
| Median | 39.6% | 32.4% |
| Interquartile 25% (IQ1) | 34.7% | 26.4% |
| Interquartile 75% (IQ3) | 52.4% | 42.6% |
| Interquartile Range (IQR) | 17.8% | 16.2% |
| Standard Deviation (Sample) | 18.9% | 26.2% |
| Standard Deviation (Population) | 18.7% | 25.6% |
Similar Demographics by Births to Unmarried Women
Demographics Similar to Immigrants from Guatemala by Births to Unmarried Women
In terms of births to unmarried women, the demographic groups most similar to Immigrants from Guatemala are Immigrants from Mexico (37.5%, a difference of 0.010%), Immigrants from Central America (37.4%, a difference of 0.11%), Spanish American Indian (37.4%, a difference of 0.18%), Creek (37.6%, a difference of 0.23%), and Liberian (37.4%, a difference of 0.26%).
| Demographics | Rating | Rank | Births to Unmarried Women |
| West Indians | 0.1 /100 | #279 | Tragic 37.3% |
| Immigrants | St. Vincent and the Grenadines | 0.1 /100 | #280 | Tragic 37.3% |
| Immigrants | Belize | 0.1 /100 | #281 | Tragic 37.3% |
| Liberians | 0.0 /100 | #282 | Tragic 37.4% |
| Spanish American Indians | 0.0 /100 | #283 | Tragic 37.4% |
| Immigrants | Central America | 0.0 /100 | #284 | Tragic 37.4% |
| Immigrants | Mexico | 0.0 /100 | #285 | Tragic 37.5% |
| Immigrants | Guatemala | 0.0 /100 | #286 | Tragic 37.5% |
| Creek | 0.0 /100 | #287 | Tragic 37.6% |
| Immigrants | Liberia | 0.0 /100 | #288 | Tragic 37.6% |
| Alaskan Athabascans | 0.0 /100 | #289 | Tragic 37.7% |
| Hispanics or Latinos | 0.0 /100 | #290 | Tragic 37.8% |
| Seminole | 0.0 /100 | #291 | Tragic 37.9% |
| Blackfeet | 0.0 /100 | #292 | Tragic 37.9% |
| Immigrants | Nicaragua | 0.0 /100 | #293 | Tragic 38.0% |
Demographics Similar to Lebanese by Births to Unmarried Women
In terms of births to unmarried women, the demographic groups most similar to Lebanese are Lithuanian (29.6%, a difference of 0.010%), Australian (29.5%, a difference of 0.050%), Immigrants from Nepal (29.6%, a difference of 0.060%), Immigrants from Northern Africa (29.5%, a difference of 0.13%), and Swedish (29.6%, a difference of 0.32%).
| Demographics | Rating | Rank | Births to Unmarried Women |
| Norwegians | 95.8 /100 | #96 | Exceptional 29.3% |
| Immigrants | South Africa | 95.7 /100 | #97 | Exceptional 29.3% |
| Immigrants | Syria | 95.7 /100 | #98 | Exceptional 29.4% |
| Immigrants | Denmark | 95.3 /100 | #99 | Exceptional 29.4% |
| Luxembourgers | 95.2 /100 | #100 | Exceptional 29.4% |
| Immigrants | Northern Africa | 94.7 /100 | #101 | Exceptional 29.5% |
| Australians | 94.6 /100 | #102 | Exceptional 29.5% |
| Lebanese | 94.4 /100 | #103 | Exceptional 29.5% |
| Lithuanians | 94.4 /100 | #104 | Exceptional 29.6% |
| Immigrants | Nepal | 94.3 /100 | #105 | Exceptional 29.6% |
| Swedes | 93.8 /100 | #106 | Exceptional 29.6% |
| Immigrants | Brazil | 93.7 /100 | #107 | Exceptional 29.6% |
| Paraguayans | 93.5 /100 | #108 | Exceptional 29.7% |
| Greeks | 93.4 /100 | #109 | Exceptional 29.7% |
| Immigrants | Ethiopia | 93.4 /100 | #110 | Exceptional 29.7% |