Immigrants from Ghana vs Immigrants from Lebanon Single Father Households
COMPARE
Immigrants from Ghana
Immigrants from Lebanon
Single Father Households
Single Father Households Comparison
Immigrants from Ghana
Immigrants from Lebanon
2.4%
SINGLE FATHER HOUSEHOLDS
9.1/ 100
METRIC RATING
228th/ 347
METRIC RANK
2.0%
SINGLE FATHER HOUSEHOLDS
100.0/ 100
METRIC RATING
46th/ 347
METRIC RANK
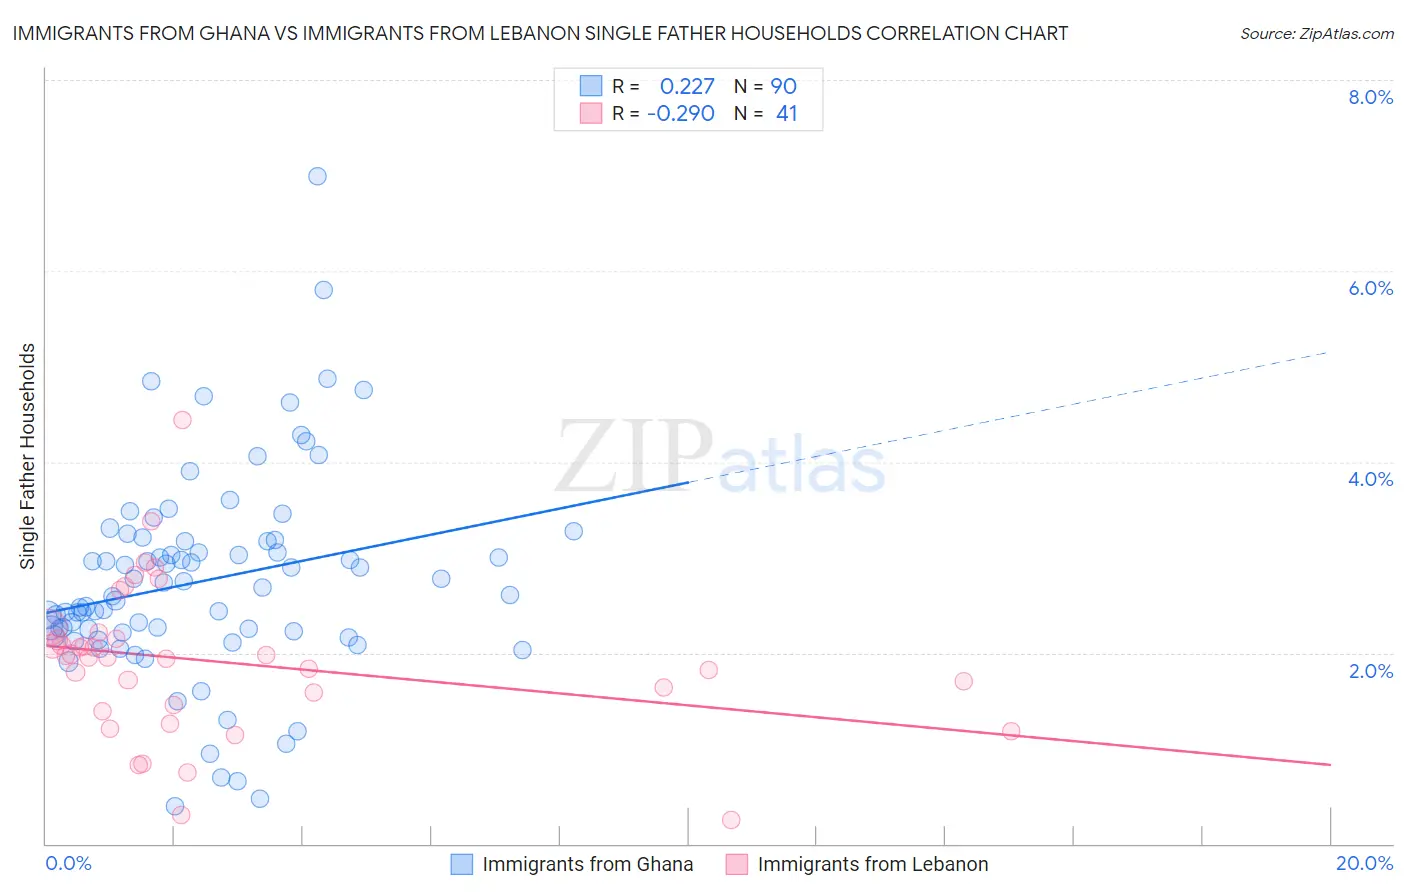
Immigrants from Ghana vs Immigrants from Lebanon Single Father Households Correlation Chart
The statistical analysis conducted on geographies consisting of 199,188,278 people shows a weak positive correlation between the proportion of Immigrants from Ghana and percentage of single father households in the United States with a correlation coefficient (R) of 0.227 and weighted average of 2.4%. Similarly, the statistical analysis conducted on geographies consisting of 216,181,283 people shows a weak negative correlation between the proportion of Immigrants from Lebanon and percentage of single father households in the United States with a correlation coefficient (R) of -0.290 and weighted average of 2.0%, a difference of 21.3%.
Single Father Households Correlation Summary
| Measurement | Immigrants from Ghana | Immigrants from Lebanon |
| Minimum | 0.39% | 0.25% |
| Maximum | 7.0% | 4.4% |
| Range | 6.6% | 4.2% |
| Mean | 2.8% | 1.9% |
| Median | 2.6% | 2.0% |
| Interquartile 25% (IQ1) | 2.2% | 1.4% |
| Interquartile 75% (IQ3) | 3.2% | 2.2% |
| Interquartile Range (IQR) | 0.96% | 0.76% |
| Standard Deviation (Sample) | 1.1% | 0.80% |
| Standard Deviation (Population) | 1.1% | 0.79% |
Similar Demographics by Single Father Households
Demographics Similar to Immigrants from Ghana by Single Father Households
In terms of single father households, the demographic groups most similar to Immigrants from Ghana are American (2.4%, a difference of 0.040%), Black/African American (2.4%, a difference of 0.11%), Immigrants from Zaire (2.4%, a difference of 0.11%), Marshallese (2.4%, a difference of 0.12%), and Subsaharan African (2.4%, a difference of 0.20%).
| Demographics | Rating | Rank | Single Father Households |
| Immigrants | Burma/Myanmar | 12.1 /100 | #221 | Poor 2.4% |
| Immigrants | Eastern Africa | 11.9 /100 | #222 | Poor 2.4% |
| Immigrants | Uruguay | 11.0 /100 | #223 | Poor 2.4% |
| Immigrants | Bahamas | 10.6 /100 | #224 | Poor 2.4% |
| Marshallese | 9.7 /100 | #225 | Tragic 2.4% |
| Blacks/African Americans | 9.7 /100 | #226 | Tragic 2.4% |
| Americans | 9.3 /100 | #227 | Tragic 2.4% |
| Immigrants | Ghana | 9.1 /100 | #228 | Tragic 2.4% |
| Immigrants | Zaire | 8.6 /100 | #229 | Tragic 2.4% |
| Sub-Saharan Africans | 8.3 /100 | #230 | Tragic 2.4% |
| Immigrants | Nonimmigrants | 7.6 /100 | #231 | Tragic 2.4% |
| Pennsylvania Germans | 7.3 /100 | #232 | Tragic 2.4% |
| Immigrants | Western Africa | 7.0 /100 | #233 | Tragic 2.4% |
| Africans | 6.3 /100 | #234 | Tragic 2.5% |
| Immigrants | Immigrants | 6.3 /100 | #235 | Tragic 2.5% |
Demographics Similar to Immigrants from Lebanon by Single Father Households
In terms of single father households, the demographic groups most similar to Immigrants from Lebanon are Russian (2.0%, a difference of 0.10%), Latvian (2.0%, a difference of 0.12%), Immigrants from Grenada (2.0%, a difference of 0.21%), Immigrants from Ukraine (2.0%, a difference of 0.35%), and Immigrants from Kazakhstan (2.0%, a difference of 0.37%).
| Demographics | Rating | Rank | Single Father Households |
| Immigrants | Sri Lanka | 100.0 /100 | #39 | Exceptional 2.0% |
| Immigrants | Bulgaria | 100.0 /100 | #40 | Exceptional 2.0% |
| Immigrants | Turkey | 100.0 /100 | #41 | Exceptional 2.0% |
| Macedonians | 100.0 /100 | #42 | Exceptional 2.0% |
| Immigrants | Grenada | 100.0 /100 | #43 | Exceptional 2.0% |
| Latvians | 100.0 /100 | #44 | Exceptional 2.0% |
| Russians | 100.0 /100 | #45 | Exceptional 2.0% |
| Immigrants | Lebanon | 100.0 /100 | #46 | Exceptional 2.0% |
| Immigrants | Ukraine | 99.9 /100 | #47 | Exceptional 2.0% |
| Immigrants | Kazakhstan | 99.9 /100 | #48 | Exceptional 2.0% |
| Immigrants | Serbia | 99.9 /100 | #49 | Exceptional 2.0% |
| Immigrants | Switzerland | 99.9 /100 | #50 | Exceptional 2.0% |
| Immigrants | Poland | 99.9 /100 | #51 | Exceptional 2.0% |
| Immigrants | Europe | 99.9 /100 | #52 | Exceptional 2.0% |
| Immigrants | Northern Europe | 99.9 /100 | #53 | Exceptional 2.0% |