Immigrants from Ghana vs Immigrants from Haiti Single Father Households
COMPARE
Immigrants from Ghana
Immigrants from Haiti
Single Father Households
Single Father Households Comparison
Immigrants from Ghana
Immigrants from Haiti
2.4%
SINGLE FATHER HOUSEHOLDS
9.1/ 100
METRIC RATING
228th/ 347
METRIC RANK
2.6%
SINGLE FATHER HOUSEHOLDS
0.1/ 100
METRIC RATING
276th/ 347
METRIC RANK
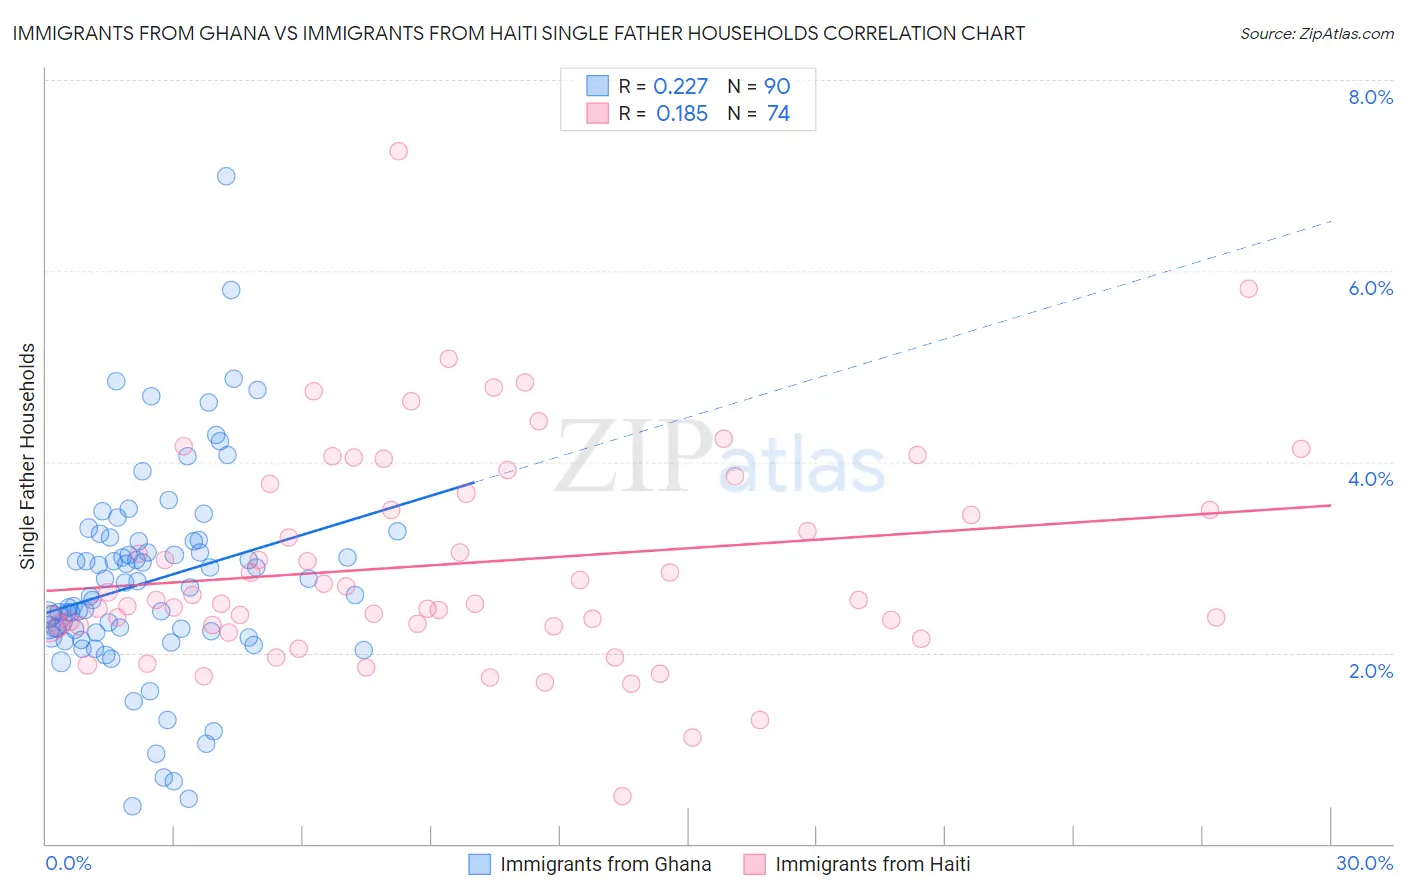
Immigrants from Ghana vs Immigrants from Haiti Single Father Households Correlation Chart
The statistical analysis conducted on geographies consisting of 199,188,278 people shows a weak positive correlation between the proportion of Immigrants from Ghana and percentage of single father households in the United States with a correlation coefficient (R) of 0.227 and weighted average of 2.4%. Similarly, the statistical analysis conducted on geographies consisting of 223,962,598 people shows a poor positive correlation between the proportion of Immigrants from Haiti and percentage of single father households in the United States with a correlation coefficient (R) of 0.185 and weighted average of 2.6%, a difference of 7.6%.
Single Father Households Correlation Summary
| Measurement | Immigrants from Ghana | Immigrants from Haiti |
| Minimum | 0.39% | 0.50% |
| Maximum | 7.0% | 7.3% |
| Range | 6.6% | 6.8% |
| Mean | 2.8% | 2.9% |
| Median | 2.6% | 2.6% |
| Interquartile 25% (IQ1) | 2.2% | 2.3% |
| Interquartile 75% (IQ3) | 3.2% | 3.7% |
| Interquartile Range (IQR) | 0.96% | 1.4% |
| Standard Deviation (Sample) | 1.1% | 1.1% |
| Standard Deviation (Population) | 1.1% | 1.1% |
Similar Demographics by Single Father Households
Demographics Similar to Immigrants from Ghana by Single Father Households
In terms of single father households, the demographic groups most similar to Immigrants from Ghana are American (2.4%, a difference of 0.040%), Black/African American (2.4%, a difference of 0.11%), Immigrants from Zaire (2.4%, a difference of 0.11%), Marshallese (2.4%, a difference of 0.12%), and Subsaharan African (2.4%, a difference of 0.20%).
| Demographics | Rating | Rank | Single Father Households |
| Immigrants | Burma/Myanmar | 12.1 /100 | #221 | Poor 2.4% |
| Immigrants | Eastern Africa | 11.9 /100 | #222 | Poor 2.4% |
| Immigrants | Uruguay | 11.0 /100 | #223 | Poor 2.4% |
| Immigrants | Bahamas | 10.6 /100 | #224 | Poor 2.4% |
| Marshallese | 9.7 /100 | #225 | Tragic 2.4% |
| Blacks/African Americans | 9.7 /100 | #226 | Tragic 2.4% |
| Americans | 9.3 /100 | #227 | Tragic 2.4% |
| Immigrants | Ghana | 9.1 /100 | #228 | Tragic 2.4% |
| Immigrants | Zaire | 8.6 /100 | #229 | Tragic 2.4% |
| Sub-Saharan Africans | 8.3 /100 | #230 | Tragic 2.4% |
| Immigrants | Nonimmigrants | 7.6 /100 | #231 | Tragic 2.4% |
| Pennsylvania Germans | 7.3 /100 | #232 | Tragic 2.4% |
| Immigrants | Western Africa | 7.0 /100 | #233 | Tragic 2.4% |
| Africans | 6.3 /100 | #234 | Tragic 2.5% |
| Immigrants | Immigrants | 6.3 /100 | #235 | Tragic 2.5% |
Demographics Similar to Immigrants from Haiti by Single Father Households
In terms of single father households, the demographic groups most similar to Immigrants from Haiti are Shoshone (2.6%, a difference of 0.030%), Cherokee (2.6%, a difference of 0.080%), Samoan (2.6%, a difference of 0.12%), Immigrants from Dominican Republic (2.6%, a difference of 0.21%), and Puerto Rican (2.6%, a difference of 0.63%).
| Demographics | Rating | Rank | Single Father Households |
| Cubans | 0.3 /100 | #269 | Tragic 2.6% |
| Seminole | 0.3 /100 | #270 | Tragic 2.6% |
| Creek | 0.2 /100 | #271 | Tragic 2.6% |
| Belizeans | 0.2 /100 | #272 | Tragic 2.6% |
| Iroquois | 0.2 /100 | #273 | Tragic 2.6% |
| Puerto Ricans | 0.2 /100 | #274 | Tragic 2.6% |
| Immigrants | Dominican Republic | 0.2 /100 | #275 | Tragic 2.6% |
| Immigrants | Haiti | 0.1 /100 | #276 | Tragic 2.6% |
| Shoshone | 0.1 /100 | #277 | Tragic 2.6% |
| Cherokee | 0.1 /100 | #278 | Tragic 2.6% |
| Samoans | 0.1 /100 | #279 | Tragic 2.6% |
| Immigrants | Portugal | 0.1 /100 | #280 | Tragic 2.6% |
| Nicaraguans | 0.1 /100 | #281 | Tragic 2.6% |
| Dutch West Indians | 0.1 /100 | #282 | Tragic 2.6% |
| Immigrants | Nicaragua | 0.1 /100 | #283 | Tragic 2.7% |