Immigrants from Romania vs Immigrants from Lebanon Single Father Households
COMPARE
Immigrants from Romania
Immigrants from Lebanon
Single Father Households
Single Father Households Comparison
Immigrants from Romania
Immigrants from Lebanon
2.1%
SINGLE FATHER HOUSEHOLDS
99.8/ 100
METRIC RATING
69th/ 347
METRIC RANK
2.0%
SINGLE FATHER HOUSEHOLDS
100.0/ 100
METRIC RATING
46th/ 347
METRIC RANK
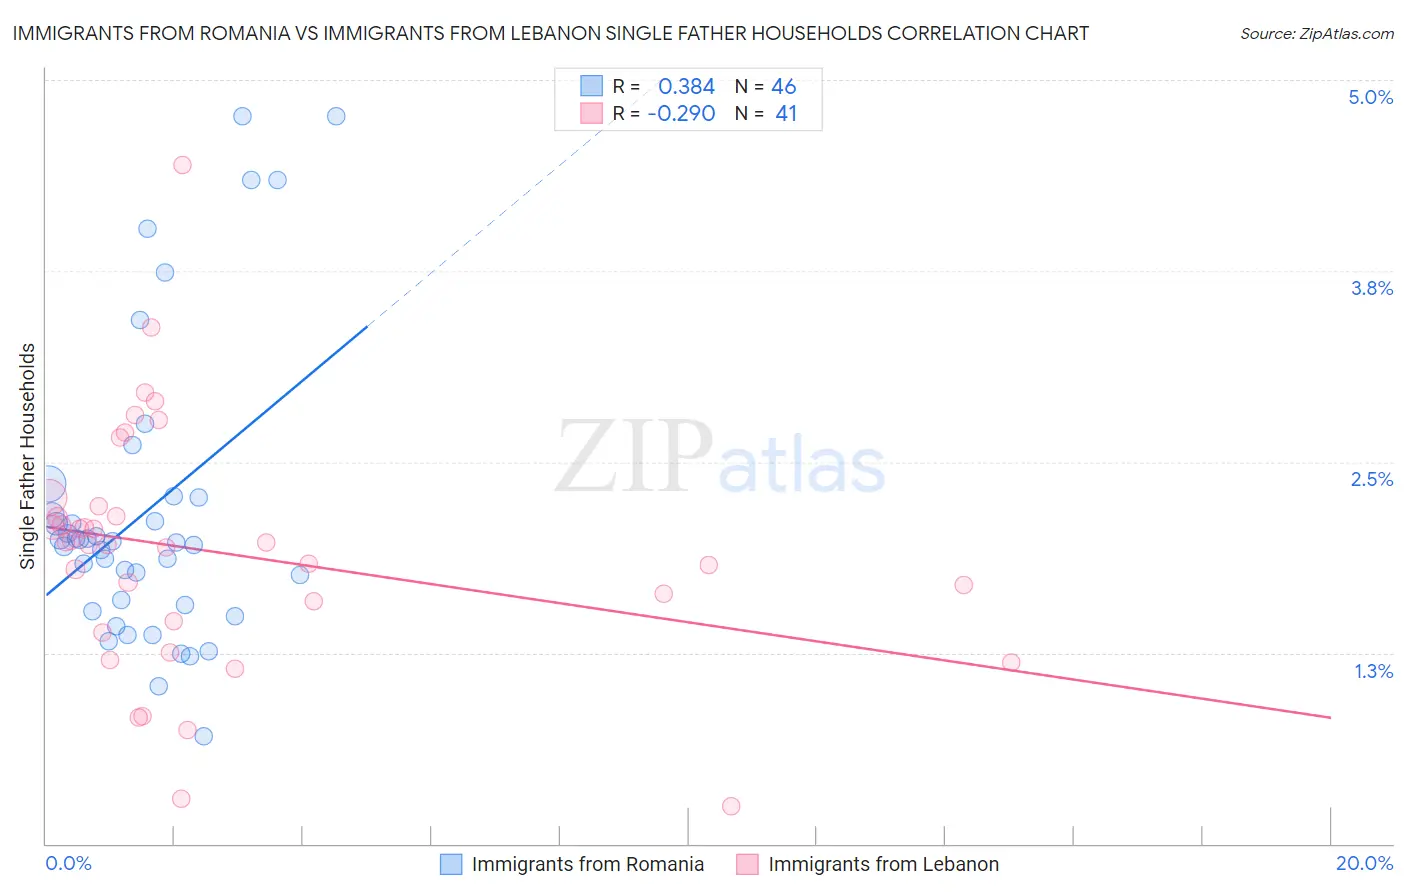
Immigrants from Romania vs Immigrants from Lebanon Single Father Households Correlation Chart
The statistical analysis conducted on geographies consisting of 255,577,760 people shows a mild positive correlation between the proportion of Immigrants from Romania and percentage of single father households in the United States with a correlation coefficient (R) of 0.384 and weighted average of 2.1%. Similarly, the statistical analysis conducted on geographies consisting of 216,181,283 people shows a weak negative correlation between the proportion of Immigrants from Lebanon and percentage of single father households in the United States with a correlation coefficient (R) of -0.290 and weighted average of 2.0%, a difference of 2.7%.
Single Father Households Correlation Summary
| Measurement | Immigrants from Romania | Immigrants from Lebanon |
| Minimum | 0.71% | 0.25% |
| Maximum | 4.8% | 4.4% |
| Range | 4.1% | 4.2% |
| Mean | 2.2% | 1.9% |
| Median | 2.0% | 2.0% |
| Interquartile 25% (IQ1) | 1.6% | 1.4% |
| Interquartile 75% (IQ3) | 2.3% | 2.2% |
| Interquartile Range (IQR) | 0.71% | 0.76% |
| Standard Deviation (Sample) | 0.97% | 0.80% |
| Standard Deviation (Population) | 0.96% | 0.79% |
Similar Demographics by Single Father Households
Demographics Similar to Immigrants from Romania by Single Father Households
In terms of single father households, the demographic groups most similar to Immigrants from Romania are Immigrants from Denmark (2.1%, a difference of 0.020%), Immigrants from Italy (2.1%, a difference of 0.11%), Immigrants from Western Asia (2.1%, a difference of 0.16%), Egyptian (2.1%, a difference of 0.21%), and Immigrants from Kuwait (2.1%, a difference of 0.22%).
| Demographics | Rating | Rank | Single Father Households |
| Immigrants | Malaysia | 99.9 /100 | #62 | Exceptional 2.0% |
| Maltese | 99.9 /100 | #63 | Exceptional 2.0% |
| Mongolians | 99.9 /100 | #64 | Exceptional 2.1% |
| Paraguayans | 99.9 /100 | #65 | Exceptional 2.1% |
| Immigrants | Western Asia | 99.8 /100 | #66 | Exceptional 2.1% |
| Immigrants | Italy | 99.8 /100 | #67 | Exceptional 2.1% |
| Immigrants | Denmark | 99.8 /100 | #68 | Exceptional 2.1% |
| Immigrants | Romania | 99.8 /100 | #69 | Exceptional 2.1% |
| Egyptians | 99.8 /100 | #70 | Exceptional 2.1% |
| Immigrants | Kuwait | 99.8 /100 | #71 | Exceptional 2.1% |
| Immigrants | Spain | 99.8 /100 | #72 | Exceptional 2.1% |
| Immigrants | Bangladesh | 99.8 /100 | #73 | Exceptional 2.1% |
| Immigrants | Egypt | 99.8 /100 | #74 | Exceptional 2.1% |
| Immigrants | Sweden | 99.8 /100 | #75 | Exceptional 2.1% |
| Immigrants | Scotland | 99.8 /100 | #76 | Exceptional 2.1% |
Demographics Similar to Immigrants from Lebanon by Single Father Households
In terms of single father households, the demographic groups most similar to Immigrants from Lebanon are Russian (2.0%, a difference of 0.10%), Latvian (2.0%, a difference of 0.12%), Immigrants from Grenada (2.0%, a difference of 0.21%), Immigrants from Ukraine (2.0%, a difference of 0.35%), and Immigrants from Kazakhstan (2.0%, a difference of 0.37%).
| Demographics | Rating | Rank | Single Father Households |
| Immigrants | Sri Lanka | 100.0 /100 | #39 | Exceptional 2.0% |
| Immigrants | Bulgaria | 100.0 /100 | #40 | Exceptional 2.0% |
| Immigrants | Turkey | 100.0 /100 | #41 | Exceptional 2.0% |
| Macedonians | 100.0 /100 | #42 | Exceptional 2.0% |
| Immigrants | Grenada | 100.0 /100 | #43 | Exceptional 2.0% |
| Latvians | 100.0 /100 | #44 | Exceptional 2.0% |
| Russians | 100.0 /100 | #45 | Exceptional 2.0% |
| Immigrants | Lebanon | 100.0 /100 | #46 | Exceptional 2.0% |
| Immigrants | Ukraine | 99.9 /100 | #47 | Exceptional 2.0% |
| Immigrants | Kazakhstan | 99.9 /100 | #48 | Exceptional 2.0% |
| Immigrants | Serbia | 99.9 /100 | #49 | Exceptional 2.0% |
| Immigrants | Switzerland | 99.9 /100 | #50 | Exceptional 2.0% |
| Immigrants | Poland | 99.9 /100 | #51 | Exceptional 2.0% |
| Immigrants | Europe | 99.9 /100 | #52 | Exceptional 2.0% |
| Immigrants | Northern Europe | 99.9 /100 | #53 | Exceptional 2.0% |