Immigrants from Ghana vs Romanian Single Father Households
COMPARE
Immigrants from Ghana
Romanian
Single Father Households
Single Father Households Comparison
Immigrants from Ghana
Romanians
2.4%
SINGLE FATHER HOUSEHOLDS
9.1/ 100
METRIC RATING
228th/ 347
METRIC RANK
2.1%
SINGLE FATHER HOUSEHOLDS
99.4/ 100
METRIC RATING
92nd/ 347
METRIC RANK
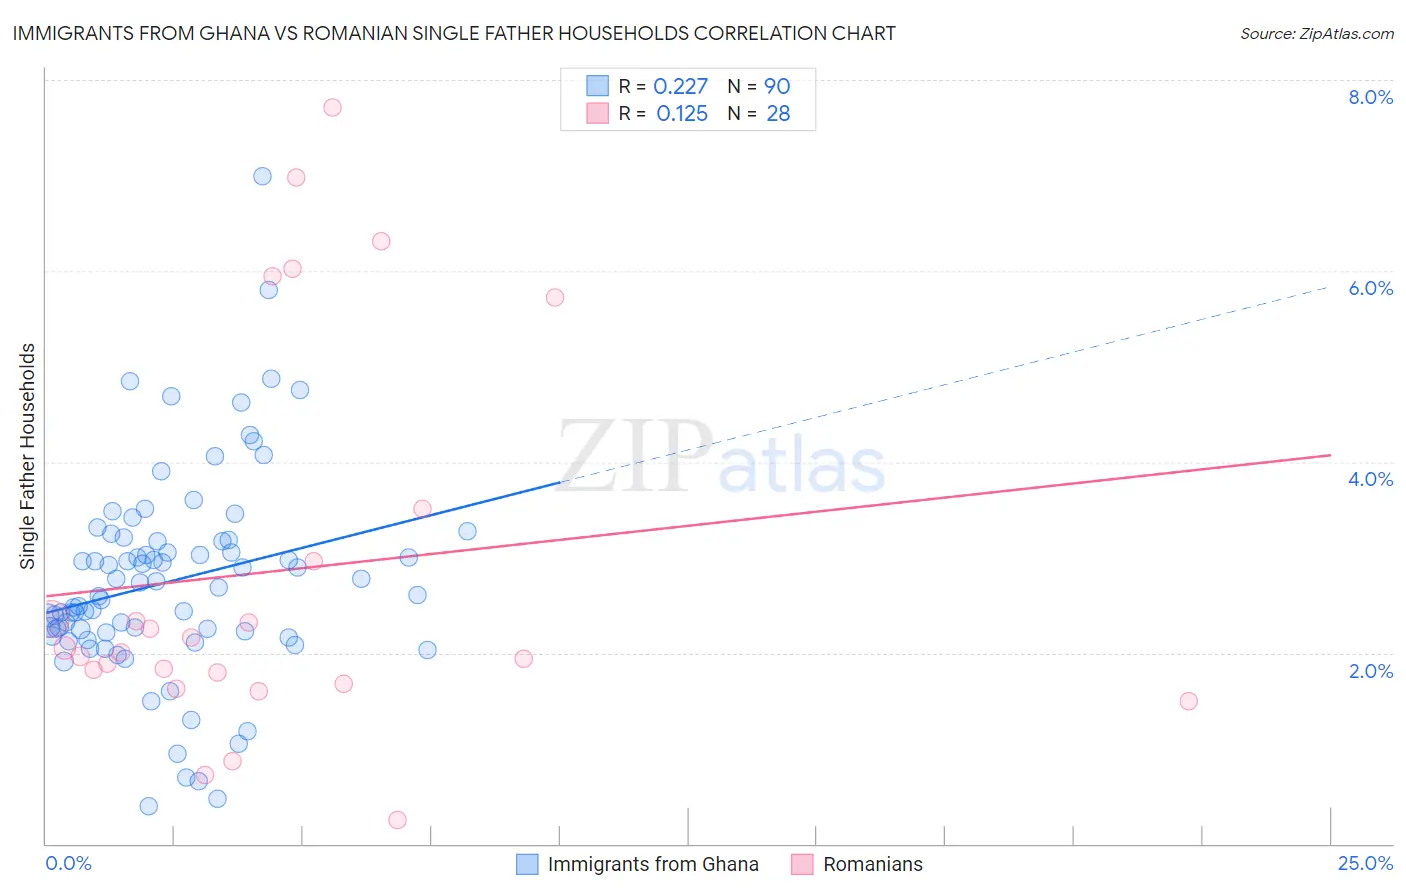
Immigrants from Ghana vs Romanian Single Father Households Correlation Chart
The statistical analysis conducted on geographies consisting of 199,188,278 people shows a weak positive correlation between the proportion of Immigrants from Ghana and percentage of single father households in the United States with a correlation coefficient (R) of 0.227 and weighted average of 2.4%. Similarly, the statistical analysis conducted on geographies consisting of 374,430,007 people shows a poor positive correlation between the proportion of Romanians and percentage of single father households in the United States with a correlation coefficient (R) of 0.125 and weighted average of 2.1%, a difference of 14.8%.
Single Father Households Correlation Summary
| Measurement | Immigrants from Ghana | Romanian |
| Minimum | 0.39% | 0.25% |
| Maximum | 7.0% | 7.7% |
| Range | 6.6% | 7.5% |
| Mean | 2.8% | 2.9% |
| Median | 2.6% | 2.0% |
| Interquartile 25% (IQ1) | 2.2% | 1.7% |
| Interquartile 75% (IQ3) | 3.2% | 3.2% |
| Interquartile Range (IQR) | 0.96% | 1.5% |
| Standard Deviation (Sample) | 1.1% | 2.0% |
| Standard Deviation (Population) | 1.1% | 2.0% |
Similar Demographics by Single Father Households
Demographics Similar to Immigrants from Ghana by Single Father Households
In terms of single father households, the demographic groups most similar to Immigrants from Ghana are American (2.4%, a difference of 0.040%), Black/African American (2.4%, a difference of 0.11%), Immigrants from Zaire (2.4%, a difference of 0.11%), Marshallese (2.4%, a difference of 0.12%), and Subsaharan African (2.4%, a difference of 0.20%).
| Demographics | Rating | Rank | Single Father Households |
| Immigrants | Burma/Myanmar | 12.1 /100 | #221 | Poor 2.4% |
| Immigrants | Eastern Africa | 11.9 /100 | #222 | Poor 2.4% |
| Immigrants | Uruguay | 11.0 /100 | #223 | Poor 2.4% |
| Immigrants | Bahamas | 10.6 /100 | #224 | Poor 2.4% |
| Marshallese | 9.7 /100 | #225 | Tragic 2.4% |
| Blacks/African Americans | 9.7 /100 | #226 | Tragic 2.4% |
| Americans | 9.3 /100 | #227 | Tragic 2.4% |
| Immigrants | Ghana | 9.1 /100 | #228 | Tragic 2.4% |
| Immigrants | Zaire | 8.6 /100 | #229 | Tragic 2.4% |
| Sub-Saharan Africans | 8.3 /100 | #230 | Tragic 2.4% |
| Immigrants | Nonimmigrants | 7.6 /100 | #231 | Tragic 2.4% |
| Pennsylvania Germans | 7.3 /100 | #232 | Tragic 2.4% |
| Immigrants | Western Africa | 7.0 /100 | #233 | Tragic 2.4% |
| Africans | 6.3 /100 | #234 | Tragic 2.5% |
| Immigrants | Immigrants | 6.3 /100 | #235 | Tragic 2.5% |
Demographics Similar to Romanians by Single Father Households
In terms of single father households, the demographic groups most similar to Romanians are Immigrants from Guyana (2.1%, a difference of 0.090%), Croatian (2.1%, a difference of 0.11%), Ukrainian (2.1%, a difference of 0.11%), Immigrants from Pakistan (2.1%, a difference of 0.33%), and Bermudan (2.1%, a difference of 0.33%).
| Demographics | Rating | Rank | Single Father Households |
| Immigrants | Hungary | 99.6 /100 | #85 | Exceptional 2.1% |
| Asians | 99.6 /100 | #86 | Exceptional 2.1% |
| Lithuanians | 99.5 /100 | #87 | Exceptional 2.1% |
| Bhutanese | 99.5 /100 | #88 | Exceptional 2.1% |
| Immigrants | Armenia | 99.5 /100 | #89 | Exceptional 2.1% |
| Immigrants | Pakistan | 99.5 /100 | #90 | Exceptional 2.1% |
| Immigrants | Guyana | 99.4 /100 | #91 | Exceptional 2.1% |
| Romanians | 99.4 /100 | #92 | Exceptional 2.1% |
| Croatians | 99.3 /100 | #93 | Exceptional 2.1% |
| Ukrainians | 99.3 /100 | #94 | Exceptional 2.1% |
| Bermudans | 99.2 /100 | #95 | Exceptional 2.1% |
| Arabs | 99.2 /100 | #96 | Exceptional 2.1% |
| Immigrants | Moldova | 99.1 /100 | #97 | Exceptional 2.1% |
| Guyanese | 99.1 /100 | #98 | Exceptional 2.1% |
| South Africans | 99.1 /100 | #99 | Exceptional 2.1% |