Cree vs Immigrants from Haiti Single Father Households
COMPARE
Cree
Immigrants from Haiti
Single Father Households
Single Father Households Comparison
Cree
Immigrants from Haiti
2.8%
SINGLE FATHER HOUSEHOLDS
0.0/ 100
METRIC RATING
298th/ 347
METRIC RANK
2.6%
SINGLE FATHER HOUSEHOLDS
0.1/ 100
METRIC RATING
276th/ 347
METRIC RANK
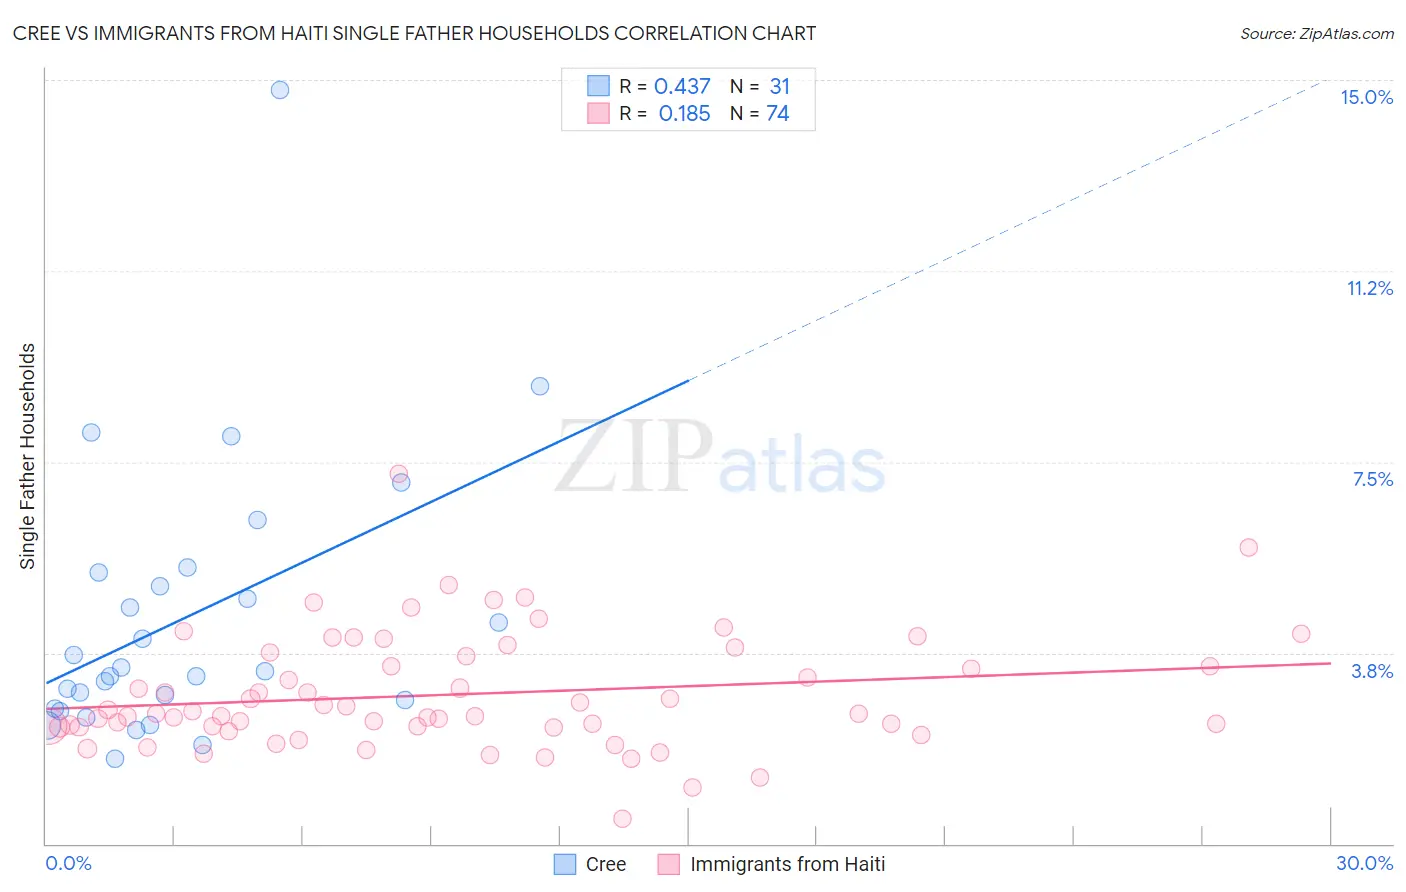
Cree vs Immigrants from Haiti Single Father Households Correlation Chart
The statistical analysis conducted on geographies consisting of 76,112,534 people shows a moderate positive correlation between the proportion of Cree and percentage of single father households in the United States with a correlation coefficient (R) of 0.437 and weighted average of 2.8%. Similarly, the statistical analysis conducted on geographies consisting of 223,962,598 people shows a poor positive correlation between the proportion of Immigrants from Haiti and percentage of single father households in the United States with a correlation coefficient (R) of 0.185 and weighted average of 2.6%, a difference of 5.6%.
Single Father Households Correlation Summary
| Measurement | Cree | Immigrants from Haiti |
| Minimum | 1.7% | 0.50% |
| Maximum | 14.8% | 7.3% |
| Range | 13.1% | 6.8% |
| Mean | 4.4% | 2.9% |
| Median | 3.4% | 2.6% |
| Interquartile 25% (IQ1) | 2.7% | 2.3% |
| Interquartile 75% (IQ3) | 5.3% | 3.7% |
| Interquartile Range (IQR) | 2.7% | 1.4% |
| Standard Deviation (Sample) | 2.7% | 1.1% |
| Standard Deviation (Population) | 2.7% | 1.1% |
Similar Demographics by Single Father Households
Demographics Similar to Cree by Single Father Households
In terms of single father households, the demographic groups most similar to Cree are Lumbee (2.8%, a difference of 0.38%), Honduran (2.8%, a difference of 0.49%), Japanese (2.8%, a difference of 0.57%), Chickasaw (2.8%, a difference of 0.59%), and Kiowa (2.8%, a difference of 0.77%).
| Demographics | Rating | Rank | Single Father Households |
| Blackfeet | 0.0 /100 | #291 | Tragic 2.7% |
| Choctaw | 0.0 /100 | #292 | Tragic 2.7% |
| Immigrants | Fiji | 0.0 /100 | #293 | Tragic 2.7% |
| Malaysians | 0.0 /100 | #294 | Tragic 2.7% |
| Chickasaw | 0.0 /100 | #295 | Tragic 2.8% |
| Japanese | 0.0 /100 | #296 | Tragic 2.8% |
| Hondurans | 0.0 /100 | #297 | Tragic 2.8% |
| Cree | 0.0 /100 | #298 | Tragic 2.8% |
| Lumbee | 0.0 /100 | #299 | Tragic 2.8% |
| Kiowa | 0.0 /100 | #300 | Tragic 2.8% |
| Immigrants | Latin America | 0.0 /100 | #301 | Tragic 2.8% |
| Spanish Americans | 0.0 /100 | #302 | Tragic 2.8% |
| Immigrants | Honduras | 0.0 /100 | #303 | Tragic 2.8% |
| Mexican American Indians | 0.0 /100 | #304 | Tragic 2.8% |
| Hispanics or Latinos | 0.0 /100 | #305 | Tragic 2.8% |
Demographics Similar to Immigrants from Haiti by Single Father Households
In terms of single father households, the demographic groups most similar to Immigrants from Haiti are Shoshone (2.6%, a difference of 0.030%), Cherokee (2.6%, a difference of 0.080%), Samoan (2.6%, a difference of 0.12%), Immigrants from Dominican Republic (2.6%, a difference of 0.21%), and Puerto Rican (2.6%, a difference of 0.63%).
| Demographics | Rating | Rank | Single Father Households |
| Cubans | 0.3 /100 | #269 | Tragic 2.6% |
| Seminole | 0.3 /100 | #270 | Tragic 2.6% |
| Creek | 0.2 /100 | #271 | Tragic 2.6% |
| Belizeans | 0.2 /100 | #272 | Tragic 2.6% |
| Iroquois | 0.2 /100 | #273 | Tragic 2.6% |
| Puerto Ricans | 0.2 /100 | #274 | Tragic 2.6% |
| Immigrants | Dominican Republic | 0.2 /100 | #275 | Tragic 2.6% |
| Immigrants | Haiti | 0.1 /100 | #276 | Tragic 2.6% |
| Shoshone | 0.1 /100 | #277 | Tragic 2.6% |
| Cherokee | 0.1 /100 | #278 | Tragic 2.6% |
| Samoans | 0.1 /100 | #279 | Tragic 2.6% |
| Immigrants | Portugal | 0.1 /100 | #280 | Tragic 2.6% |
| Nicaraguans | 0.1 /100 | #281 | Tragic 2.6% |
| Dutch West Indians | 0.1 /100 | #282 | Tragic 2.6% |
| Immigrants | Nicaragua | 0.1 /100 | #283 | Tragic 2.7% |