Immigrants from Germany vs Nicaraguan Currently Married
COMPARE
Immigrants from Germany
Nicaraguan
Currently Married
Currently Married Comparison
Immigrants from Germany
Nicaraguans
47.8%
CURRENTLY MARRIED
94.1/ 100
METRIC RATING
101st/ 347
METRIC RANK
44.2%
CURRENTLY MARRIED
0.3/ 100
METRIC RATING
248th/ 347
METRIC RANK
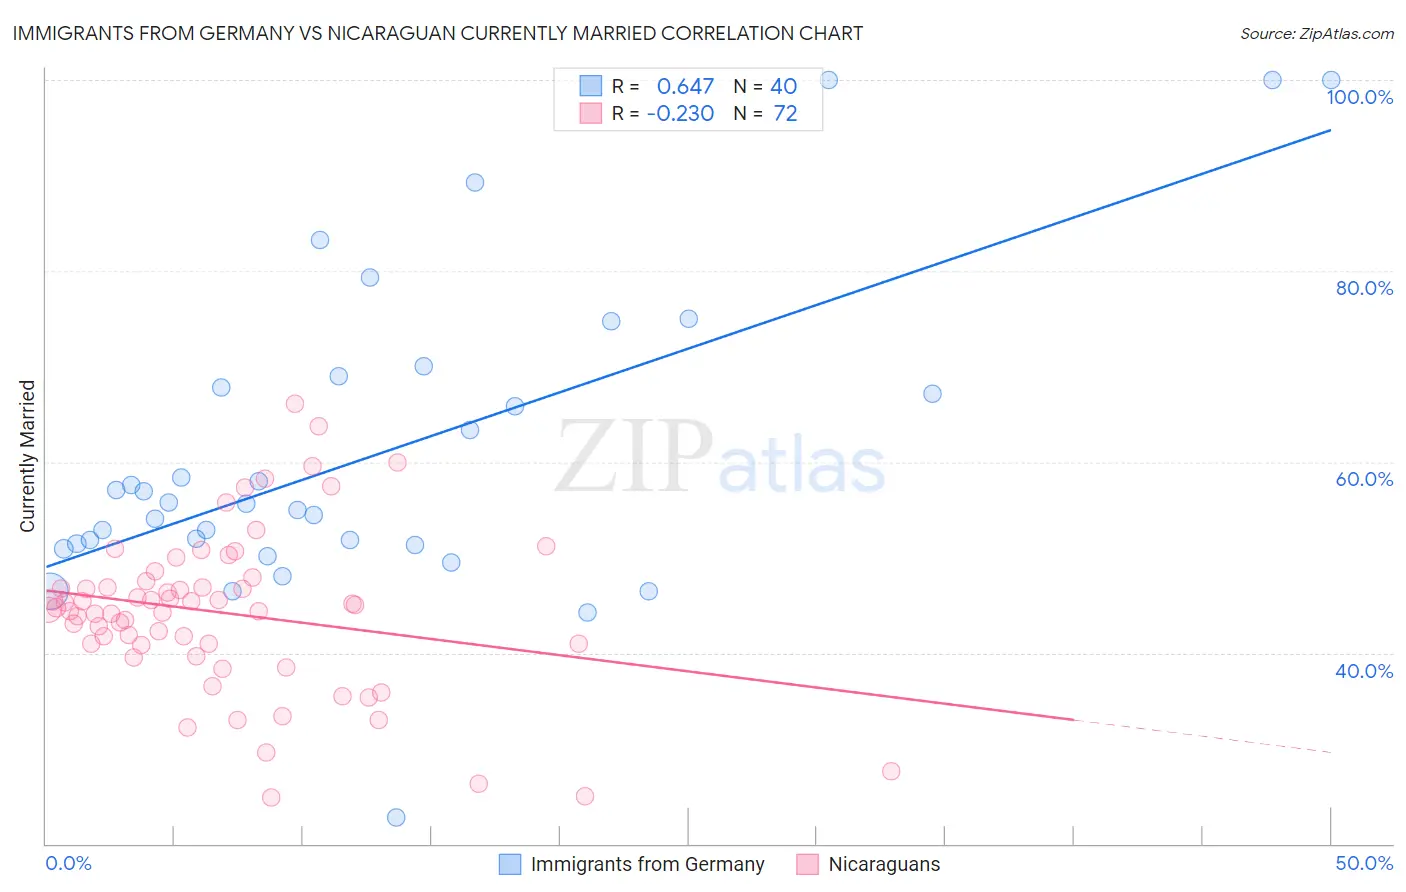
Immigrants from Germany vs Nicaraguan Currently Married Correlation Chart
The statistical analysis conducted on geographies consisting of 463,859,108 people shows a significant positive correlation between the proportion of Immigrants from Germany and percentage of population currently married in the United States with a correlation coefficient (R) of 0.647 and weighted average of 47.8%. Similarly, the statistical analysis conducted on geographies consisting of 285,678,728 people shows a weak negative correlation between the proportion of Nicaraguans and percentage of population currently married in the United States with a correlation coefficient (R) of -0.230 and weighted average of 44.2%, a difference of 8.2%.
Currently Married Correlation Summary
| Measurement | Immigrants from Germany | Nicaraguan |
| Minimum | 22.7% | 24.9% |
| Maximum | 100.0% | 66.1% |
| Range | 77.3% | 41.2% |
| Mean | 60.9% | 44.2% |
| Median | 55.7% | 44.6% |
| Interquartile 25% (IQ1) | 51.4% | 40.9% |
| Interquartile 75% (IQ3) | 68.4% | 47.2% |
| Interquartile Range (IQR) | 17.0% | 6.3% |
| Standard Deviation (Sample) | 16.5% | 8.4% |
| Standard Deviation (Population) | 16.3% | 8.3% |
Similar Demographics by Currently Married
Demographics Similar to Immigrants from Germany by Currently Married
In terms of currently married, the demographic groups most similar to Immigrants from Germany are Celtic (47.8%, a difference of 0.020%), Turkish (47.8%, a difference of 0.020%), Immigrants from Sweden (47.8%, a difference of 0.040%), Cypriot (47.8%, a difference of 0.050%), and Serbian (47.8%, a difference of 0.070%).
| Demographics | Rating | Rank | Currently Married |
| Native Hawaiians | 95.0 /100 | #94 | Exceptional 47.9% |
| Immigrants | Bulgaria | 94.8 /100 | #95 | Exceptional 47.9% |
| Egyptians | 94.8 /100 | #96 | Exceptional 47.9% |
| Immigrants | Ukraine | 94.8 /100 | #97 | Exceptional 47.9% |
| Immigrants | China | 94.7 /100 | #98 | Exceptional 47.9% |
| Immigrants | Sweden | 94.3 /100 | #99 | Exceptional 47.8% |
| Celtics | 94.2 /100 | #100 | Exceptional 47.8% |
| Immigrants | Germany | 94.1 /100 | #101 | Exceptional 47.8% |
| Turks | 93.9 /100 | #102 | Exceptional 47.8% |
| Cypriots | 93.7 /100 | #103 | Exceptional 47.8% |
| Serbians | 93.6 /100 | #104 | Exceptional 47.8% |
| Immigrants | Singapore | 93.3 /100 | #105 | Exceptional 47.8% |
| Immigrants | Greece | 93.1 /100 | #106 | Exceptional 47.7% |
| Immigrants | Italy | 92.9 /100 | #107 | Exceptional 47.7% |
| Tsimshian | 92.4 /100 | #108 | Exceptional 47.7% |
Demographics Similar to Nicaraguans by Currently Married
In terms of currently married, the demographic groups most similar to Nicaraguans are Immigrants from Cameroon (44.2%, a difference of 0.020%), Immigrants from Eastern Africa (44.2%, a difference of 0.040%), Ugandan (44.2%, a difference of 0.090%), Blackfeet (44.2%, a difference of 0.10%), and Hispanic or Latino (44.1%, a difference of 0.12%).
| Demographics | Rating | Rank | Currently Married |
| Ethiopians | 0.7 /100 | #241 | Tragic 44.5% |
| Immigrants | Cambodia | 0.7 /100 | #242 | Tragic 44.5% |
| Immigrants | Ethiopia | 0.7 /100 | #243 | Tragic 44.5% |
| Japanese | 0.6 /100 | #244 | Tragic 44.5% |
| Immigrants | Armenia | 0.4 /100 | #245 | Tragic 44.3% |
| Immigrants | Burma/Myanmar | 0.4 /100 | #246 | Tragic 44.3% |
| Ugandans | 0.4 /100 | #247 | Tragic 44.2% |
| Nicaraguans | 0.3 /100 | #248 | Tragic 44.2% |
| Immigrants | Cameroon | 0.3 /100 | #249 | Tragic 44.2% |
| Immigrants | Eastern Africa | 0.3 /100 | #250 | Tragic 44.2% |
| Blackfeet | 0.3 /100 | #251 | Tragic 44.2% |
| Hispanics or Latinos | 0.3 /100 | #252 | Tragic 44.1% |
| Immigrants | Central America | 0.3 /100 | #253 | Tragic 44.1% |
| Vietnamese | 0.2 /100 | #254 | Tragic 44.0% |
| Yakama | 0.2 /100 | #255 | Tragic 44.0% |