Immigrants from France vs Immigrants from South Eastern Asia Births to Unmarried Women
COMPARE
Immigrants from France
Immigrants from South Eastern Asia
Births to Unmarried Women
Births to Unmarried Women Comparison
Immigrants from France
Immigrants from South Eastern Asia
29.0%
BIRTHS TO UNMARRIED WOMEN
97.3/ 100
METRIC RATING
88th/ 347
METRIC RANK
30.4%
BIRTHS TO UNMARRIED WOMEN
85.2/ 100
METRIC RATING
134th/ 347
METRIC RANK
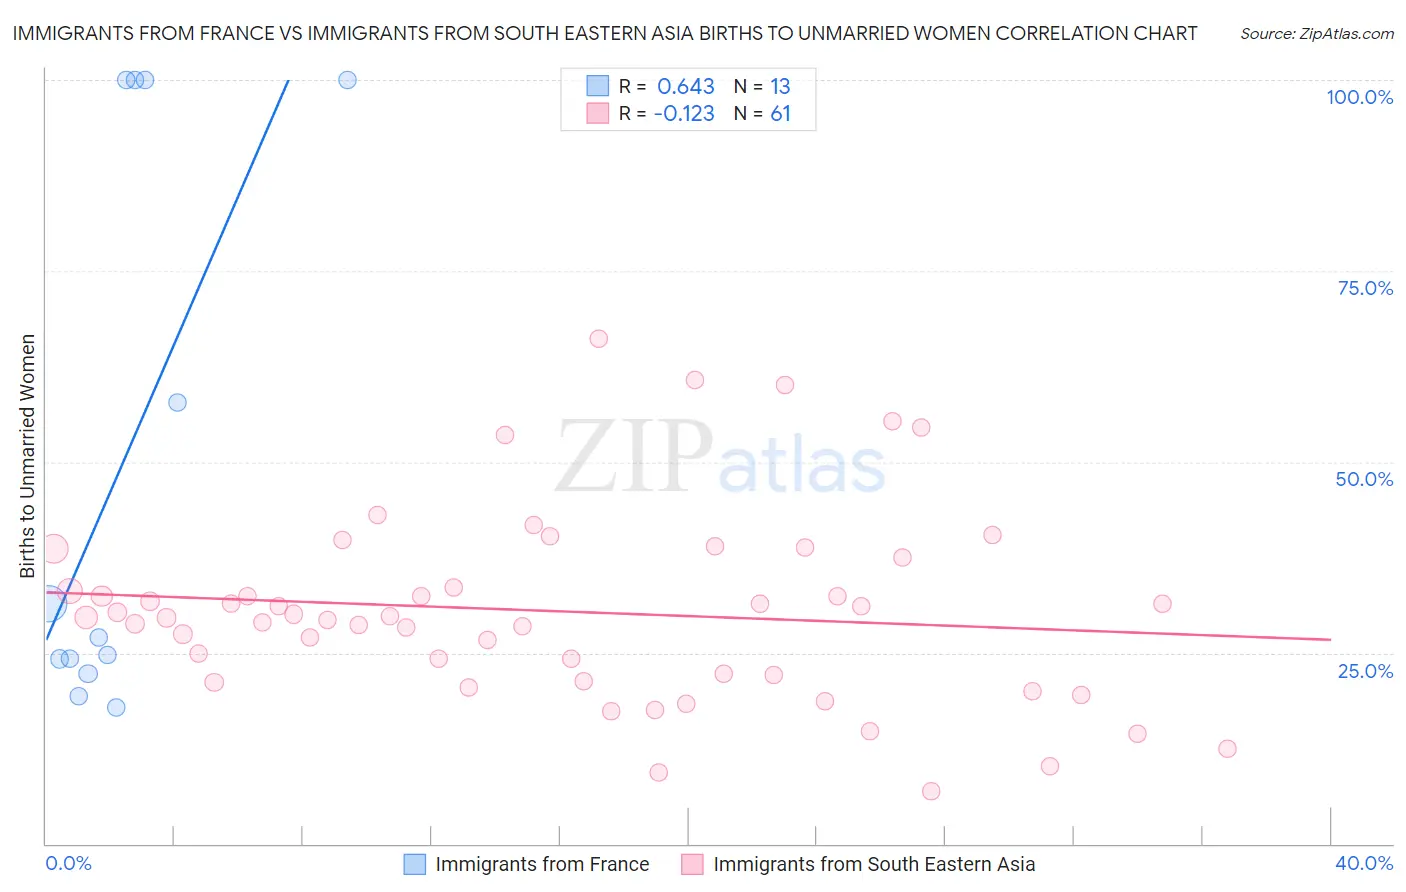
Immigrants from France vs Immigrants from South Eastern Asia Births to Unmarried Women Correlation Chart
The statistical analysis conducted on geographies consisting of 270,306,848 people shows a significant positive correlation between the proportion of Immigrants from France and percentage of births to unmarried women in the United States with a correlation coefficient (R) of 0.643 and weighted average of 29.0%. Similarly, the statistical analysis conducted on geographies consisting of 468,318,705 people shows a poor negative correlation between the proportion of Immigrants from South Eastern Asia and percentage of births to unmarried women in the United States with a correlation coefficient (R) of -0.123 and weighted average of 30.4%, a difference of 4.8%.
Births to Unmarried Women Correlation Summary
| Measurement | Immigrants from France | Immigrants from South Eastern Asia |
| Minimum | 17.9% | 6.9% |
| Maximum | 100.0% | 66.2% |
| Range | 82.1% | 59.3% |
| Mean | 49.9% | 30.4% |
| Median | 26.9% | 29.7% |
| Interquartile 25% (IQ1) | 23.2% | 21.7% |
| Interquartile 75% (IQ3) | 100.0% | 35.4% |
| Interquartile Range (IQR) | 76.8% | 13.7% |
| Standard Deviation (Sample) | 36.1% | 12.5% |
| Standard Deviation (Population) | 34.7% | 12.4% |
Similar Demographics by Births to Unmarried Women
Demographics Similar to Immigrants from France by Births to Unmarried Women
In terms of births to unmarried women, the demographic groups most similar to Immigrants from France are Taiwanese (29.0%, a difference of 0.010%), Immigrants from Jordan (29.0%, a difference of 0.080%), Sri Lankan (28.9%, a difference of 0.16%), Immigrants from Saudi Arabia (29.1%, a difference of 0.28%), and Immigrants from Poland (28.9%, a difference of 0.32%).
| Demographics | Rating | Rank | Births to Unmarried Women |
| Immigrants | Austria | 98.1 /100 | #81 | Exceptional 28.7% |
| Romanians | 98.0 /100 | #82 | Exceptional 28.7% |
| Immigrants | Kuwait | 98.0 /100 | #83 | Exceptional 28.8% |
| Immigrants | Poland | 97.6 /100 | #84 | Exceptional 28.9% |
| Sri Lankans | 97.5 /100 | #85 | Exceptional 28.9% |
| Immigrants | Jordan | 97.4 /100 | #86 | Exceptional 29.0% |
| Taiwanese | 97.3 /100 | #87 | Exceptional 29.0% |
| Immigrants | France | 97.3 /100 | #88 | Exceptional 29.0% |
| Immigrants | Saudi Arabia | 97.0 /100 | #89 | Exceptional 29.1% |
| Immigrants | Latvia | 96.8 /100 | #90 | Exceptional 29.1% |
| Immigrants | Fiji | 96.6 /100 | #91 | Exceptional 29.2% |
| Arabs | 96.5 /100 | #92 | Exceptional 29.2% |
| Estonians | 96.5 /100 | #93 | Exceptional 29.2% |
| Ukrainians | 96.3 /100 | #94 | Exceptional 29.2% |
| Immigrants | Vietnam | 96.1 /100 | #95 | Exceptional 29.3% |
Demographics Similar to Immigrants from South Eastern Asia by Births to Unmarried Women
In terms of births to unmarried women, the demographic groups most similar to Immigrants from South Eastern Asia are Immigrants from Morocco (30.4%, a difference of 0.010%), New Zealander (30.3%, a difference of 0.060%), Brazilian (30.4%, a difference of 0.070%), Immigrants from Zimbabwe (30.3%, a difference of 0.090%), and Immigrants from Bosnia and Herzegovina (30.3%, a difference of 0.10%).
| Demographics | Rating | Rank | Births to Unmarried Women |
| Chinese | 87.1 /100 | #127 | Excellent 30.2% |
| Icelanders | 86.0 /100 | #128 | Excellent 30.3% |
| Immigrants | Spain | 85.8 /100 | #129 | Excellent 30.3% |
| Immigrants | Bosnia and Herzegovina | 85.7 /100 | #130 | Excellent 30.3% |
| Immigrants | Zimbabwe | 85.7 /100 | #131 | Excellent 30.3% |
| New Zealanders | 85.5 /100 | #132 | Excellent 30.3% |
| Immigrants | Morocco | 85.2 /100 | #133 | Excellent 30.4% |
| Immigrants | South Eastern Asia | 85.2 /100 | #134 | Excellent 30.4% |
| Brazilians | 84.8 /100 | #135 | Excellent 30.4% |
| Immigrants | Scotland | 84.6 /100 | #136 | Excellent 30.4% |
| Immigrants | Philippines | 83.9 /100 | #137 | Excellent 30.4% |
| Puget Sound Salish | 83.9 /100 | #138 | Excellent 30.4% |
| Immigrants | Canada | 83.7 /100 | #139 | Excellent 30.4% |
| Swiss | 83.1 /100 | #140 | Excellent 30.5% |
| Pakistanis | 83.0 /100 | #141 | Excellent 30.5% |