Paiute vs Immigrants from South Eastern Asia Currently Married
COMPARE
Paiute
Immigrants from South Eastern Asia
Currently Married
Currently Married Comparison
Paiute
Immigrants from South Eastern Asia
42.7%
CURRENTLY MARRIED
0.0/ 100
METRIC RATING
289th/ 347
METRIC RANK
47.1%
CURRENTLY MARRIED
72.9/ 100
METRIC RATING
145th/ 347
METRIC RANK
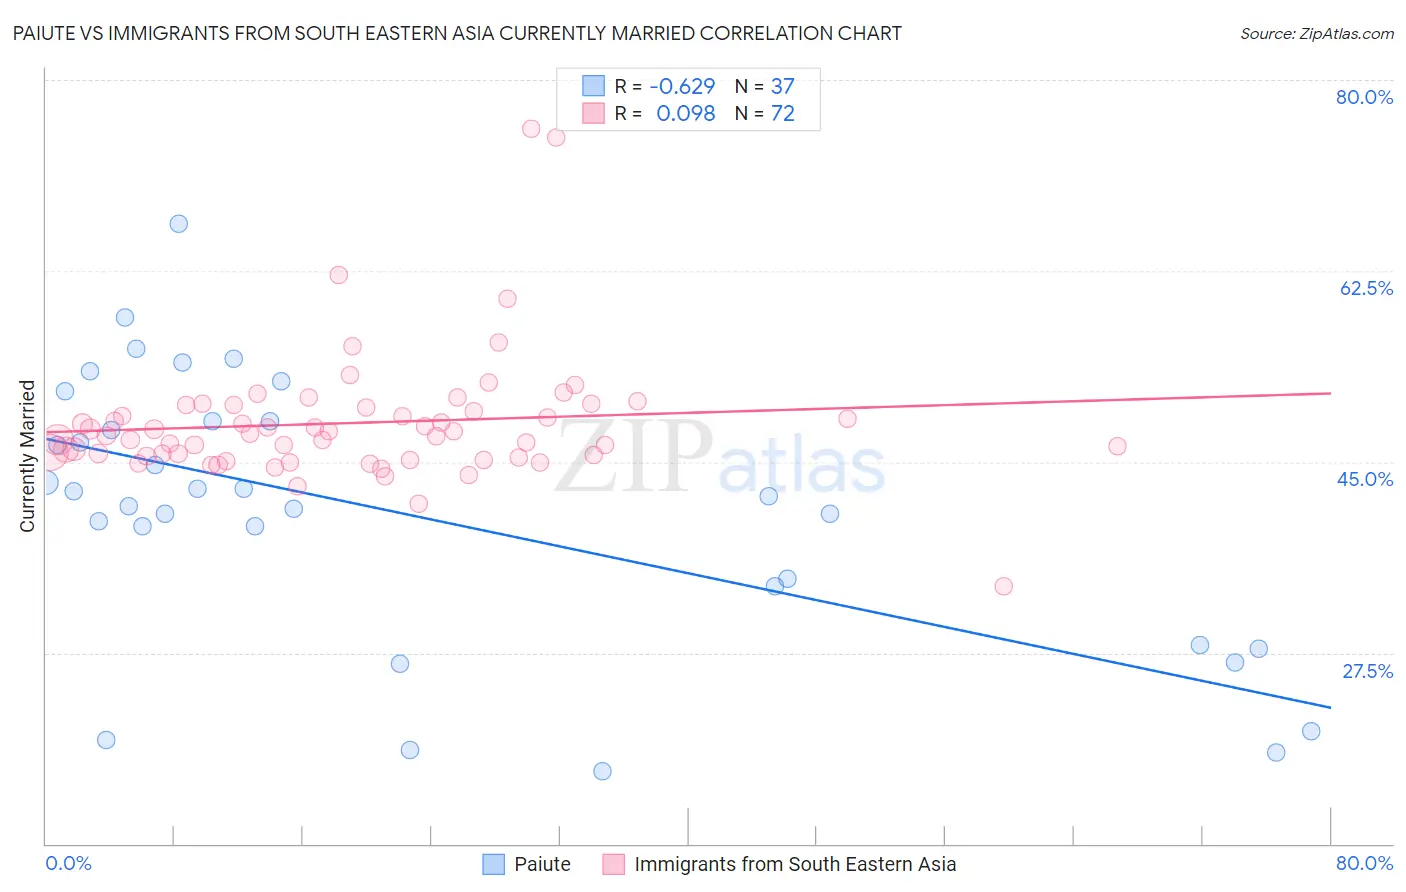
Paiute vs Immigrants from South Eastern Asia Currently Married Correlation Chart
The statistical analysis conducted on geographies consisting of 58,403,675 people shows a significant negative correlation between the proportion of Paiute and percentage of population currently married in the United States with a correlation coefficient (R) of -0.629 and weighted average of 42.7%. Similarly, the statistical analysis conducted on geographies consisting of 512,635,573 people shows a slight positive correlation between the proportion of Immigrants from South Eastern Asia and percentage of population currently married in the United States with a correlation coefficient (R) of 0.098 and weighted average of 47.1%, a difference of 10.2%.
Currently Married Correlation Summary
| Measurement | Paiute | Immigrants from South Eastern Asia |
| Minimum | 16.6% | 33.6% |
| Maximum | 66.9% | 75.5% |
| Range | 50.3% | 41.9% |
| Mean | 40.3% | 48.6% |
| Median | 41.9% | 47.5% |
| Interquartile 25% (IQ1) | 30.9% | 45.6% |
| Interquartile 75% (IQ3) | 48.7% | 50.1% |
| Interquartile Range (IQR) | 17.8% | 4.5% |
| Standard Deviation (Sample) | 12.4% | 6.0% |
| Standard Deviation (Population) | 12.2% | 5.9% |
Similar Demographics by Currently Married
Demographics Similar to Paiute by Currently Married
In terms of currently married, the demographic groups most similar to Paiute are Immigrants from Ghana (42.7%, a difference of 0.010%), Immigrants from Guatemala (42.6%, a difference of 0.12%), Native/Alaskan (42.8%, a difference of 0.23%), Subsaharan African (42.6%, a difference of 0.28%), and Yuman (42.6%, a difference of 0.30%).
| Demographics | Rating | Rank | Currently Married |
| Immigrants | Ecuador | 0.0 /100 | #282 | Tragic 43.2% |
| Kiowa | 0.0 /100 | #283 | Tragic 43.2% |
| Immigrants | El Salvador | 0.0 /100 | #284 | Tragic 43.1% |
| Immigrants | Middle Africa | 0.0 /100 | #285 | Tragic 43.0% |
| Ghanaians | 0.0 /100 | #286 | Tragic 42.9% |
| Guatemalans | 0.0 /100 | #287 | Tragic 42.9% |
| Natives/Alaskans | 0.0 /100 | #288 | Tragic 42.8% |
| Paiute | 0.0 /100 | #289 | Tragic 42.7% |
| Immigrants | Ghana | 0.0 /100 | #290 | Tragic 42.7% |
| Immigrants | Guatemala | 0.0 /100 | #291 | Tragic 42.6% |
| Sub-Saharan Africans | 0.0 /100 | #292 | Tragic 42.6% |
| Yuman | 0.0 /100 | #293 | Tragic 42.6% |
| Hondurans | 0.0 /100 | #294 | Tragic 42.5% |
| Immigrants | Western Africa | 0.0 /100 | #295 | Tragic 42.4% |
| Menominee | 0.0 /100 | #296 | Tragic 42.3% |
Demographics Similar to Immigrants from South Eastern Asia by Currently Married
In terms of currently married, the demographic groups most similar to Immigrants from South Eastern Asia are Carpatho Rusyn (47.0%, a difference of 0.010%), Hmong (47.1%, a difference of 0.030%), Immigrants from Argentina (47.0%, a difference of 0.040%), Guamanian/Chamorro (47.1%, a difference of 0.060%), and Venezuelan (47.1%, a difference of 0.070%).
| Demographics | Rating | Rank | Currently Married |
| Pakistanis | 77.5 /100 | #138 | Good 47.2% |
| Yugoslavians | 77.4 /100 | #139 | Good 47.2% |
| Cajuns | 75.3 /100 | #140 | Good 47.1% |
| Venezuelans | 74.4 /100 | #141 | Good 47.1% |
| Argentineans | 74.4 /100 | #142 | Good 47.1% |
| Guamanians/Chamorros | 74.2 /100 | #143 | Good 47.1% |
| Hmong | 73.4 /100 | #144 | Good 47.1% |
| Immigrants | South Eastern Asia | 72.9 /100 | #145 | Good 47.1% |
| Carpatho Rusyns | 72.6 /100 | #146 | Good 47.0% |
| Immigrants | Argentina | 72.0 /100 | #147 | Good 47.0% |
| Cambodians | 70.4 /100 | #148 | Good 47.0% |
| Zimbabweans | 70.1 /100 | #149 | Good 47.0% |
| Immigrants | Turkey | 70.0 /100 | #150 | Good 47.0% |
| Chileans | 69.8 /100 | #151 | Good 47.0% |
| Immigrants | Serbia | 68.8 /100 | #152 | Good 47.0% |