Immigrants from Fiji vs Immigrants from Brazil Unemployment Among Seniors over 75 years
COMPARE
Immigrants from Fiji
Immigrants from Brazil
Unemployment Among Seniors over 75 years
Unemployment Among Seniors over 75 years Comparison
Immigrants from Fiji
Immigrants from Brazil
10.0%
UNEMPLOYMENT AMONG SENIORS OVER 75 YEARS
0.0/ 100
METRIC RATING
307th/ 347
METRIC RANK
9.0%
UNEMPLOYMENT AMONG SENIORS OVER 75 YEARS
13.3/ 100
METRIC RATING
214th/ 347
METRIC RANK
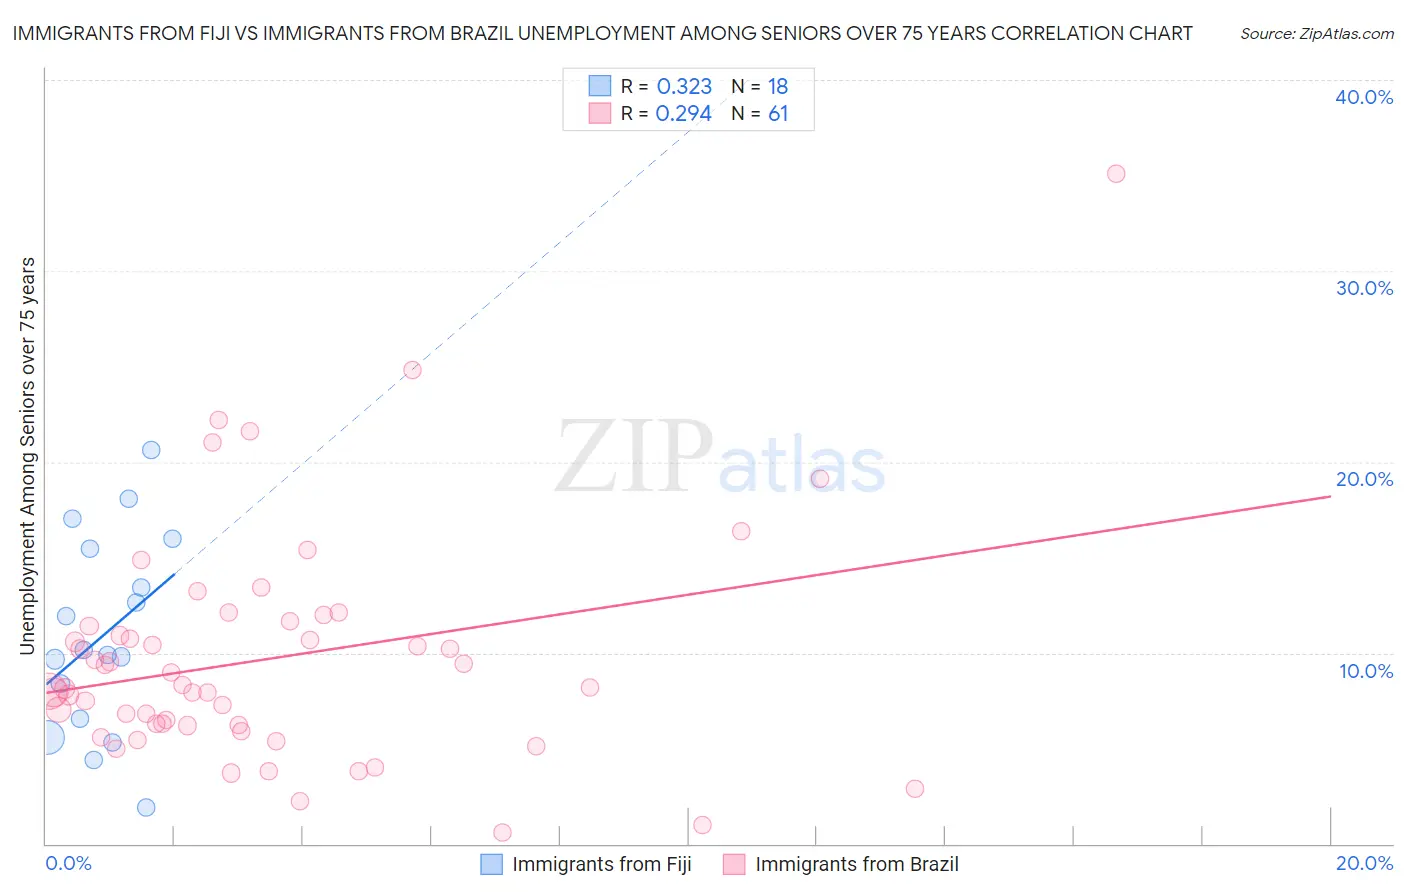
Immigrants from Fiji vs Immigrants from Brazil Unemployment Among Seniors over 75 years Correlation Chart
The statistical analysis conducted on geographies consisting of 71,825,533 people shows a mild positive correlation between the proportion of Immigrants from Fiji and unemployment rate among seniors over the age of 75 in the United States with a correlation coefficient (R) of 0.323 and weighted average of 10.0%. Similarly, the statistical analysis conducted on geographies consisting of 186,404,658 people shows a weak positive correlation between the proportion of Immigrants from Brazil and unemployment rate among seniors over the age of 75 in the United States with a correlation coefficient (R) of 0.294 and weighted average of 9.0%, a difference of 11.8%.
Unemployment Among Seniors over 75 years Correlation Summary
| Measurement | Immigrants from Fiji | Immigrants from Brazil |
| Minimum | 1.9% | 0.60% |
| Maximum | 20.6% | 35.1% |
| Range | 18.7% | 34.5% |
| Mean | 10.9% | 9.7% |
| Median | 10.0% | 8.2% |
| Interquartile 25% (IQ1) | 6.5% | 6.2% |
| Interquartile 75% (IQ3) | 15.4% | 11.5% |
| Interquartile Range (IQR) | 8.9% | 5.3% |
| Standard Deviation (Sample) | 5.2% | 6.0% |
| Standard Deviation (Population) | 5.0% | 6.0% |
Similar Demographics by Unemployment Among Seniors over 75 years
Demographics Similar to Immigrants from Fiji by Unemployment Among Seniors over 75 years
In terms of unemployment among seniors over 75 years, the demographic groups most similar to Immigrants from Fiji are Italian (10.0%, a difference of 0.13%), Swedish (10.0%, a difference of 0.27%), White/Caucasian (10.1%, a difference of 0.44%), Puget Sound Salish (10.0%, a difference of 0.47%), and Scotch-Irish (10.0%, a difference of 0.47%).
| Demographics | Rating | Rank | Unemployment Among Seniors over 75 years |
| Iraqis | 0.0 /100 | #300 | Tragic 9.9% |
| Welsh | 0.0 /100 | #301 | Tragic 10.0% |
| Finns | 0.0 /100 | #302 | Tragic 10.0% |
| Puget Sound Salish | 0.0 /100 | #303 | Tragic 10.0% |
| Scotch-Irish | 0.0 /100 | #304 | Tragic 10.0% |
| Swedes | 0.0 /100 | #305 | Tragic 10.0% |
| Italians | 0.0 /100 | #306 | Tragic 10.0% |
| Immigrants | Fiji | 0.0 /100 | #307 | Tragic 10.0% |
| Whites/Caucasians | 0.0 /100 | #308 | Tragic 10.1% |
| English | 0.0 /100 | #309 | Tragic 10.1% |
| Hungarians | 0.0 /100 | #310 | Tragic 10.1% |
| Scottish | 0.0 /100 | #311 | Tragic 10.1% |
| Chippewa | 0.0 /100 | #312 | Tragic 10.1% |
| Nepalese | 0.0 /100 | #313 | Tragic 10.1% |
| Dutch West Indians | 0.0 /100 | #314 | Tragic 10.2% |
Demographics Similar to Immigrants from Brazil by Unemployment Among Seniors over 75 years
In terms of unemployment among seniors over 75 years, the demographic groups most similar to Immigrants from Brazil are Immigrants from Latin America (9.0%, a difference of 0.020%), Romanian (9.0%, a difference of 0.050%), Immigrants from Western Asia (9.0%, a difference of 0.090%), Delaware (9.0%, a difference of 0.14%), and Immigrants from Oceania (9.0%, a difference of 0.18%).
| Demographics | Rating | Rank | Unemployment Among Seniors over 75 years |
| Malaysians | 16.3 /100 | #207 | Poor 8.9% |
| Immigrants | Philippines | 15.8 /100 | #208 | Poor 8.9% |
| Salvadorans | 15.4 /100 | #209 | Poor 8.9% |
| Bermudans | 15.0 /100 | #210 | Poor 8.9% |
| Delaware | 14.6 /100 | #211 | Poor 9.0% |
| Romanians | 13.8 /100 | #212 | Poor 9.0% |
| Immigrants | Latin America | 13.4 /100 | #213 | Poor 9.0% |
| Immigrants | Brazil | 13.3 /100 | #214 | Poor 9.0% |
| Immigrants | Western Asia | 12.5 /100 | #215 | Poor 9.0% |
| Immigrants | Oceania | 11.8 /100 | #216 | Poor 9.0% |
| Lebanese | 11.1 /100 | #217 | Poor 9.0% |
| Immigrants | Africa | 9.7 /100 | #218 | Tragic 9.0% |
| Afghans | 8.3 /100 | #219 | Tragic 9.0% |
| Immigrants | Zimbabwe | 7.8 /100 | #220 | Tragic 9.0% |
| Guamanians/Chamorros | 7.7 /100 | #221 | Tragic 9.0% |