Immigrants from Fiji vs Immigrants from Afghanistan Family Households
COMPARE
Immigrants from Fiji
Immigrants from Afghanistan
Family Households
Family Households Comparison
Immigrants from Fiji
Immigrants from Afghanistan
68.8%
FAMILY HOUSEHOLDS
100.0/ 100
METRIC RATING
8th/ 347
METRIC RANK
65.9%
FAMILY HOUSEHOLDS
99.9/ 100
METRIC RATING
70th/ 347
METRIC RANK
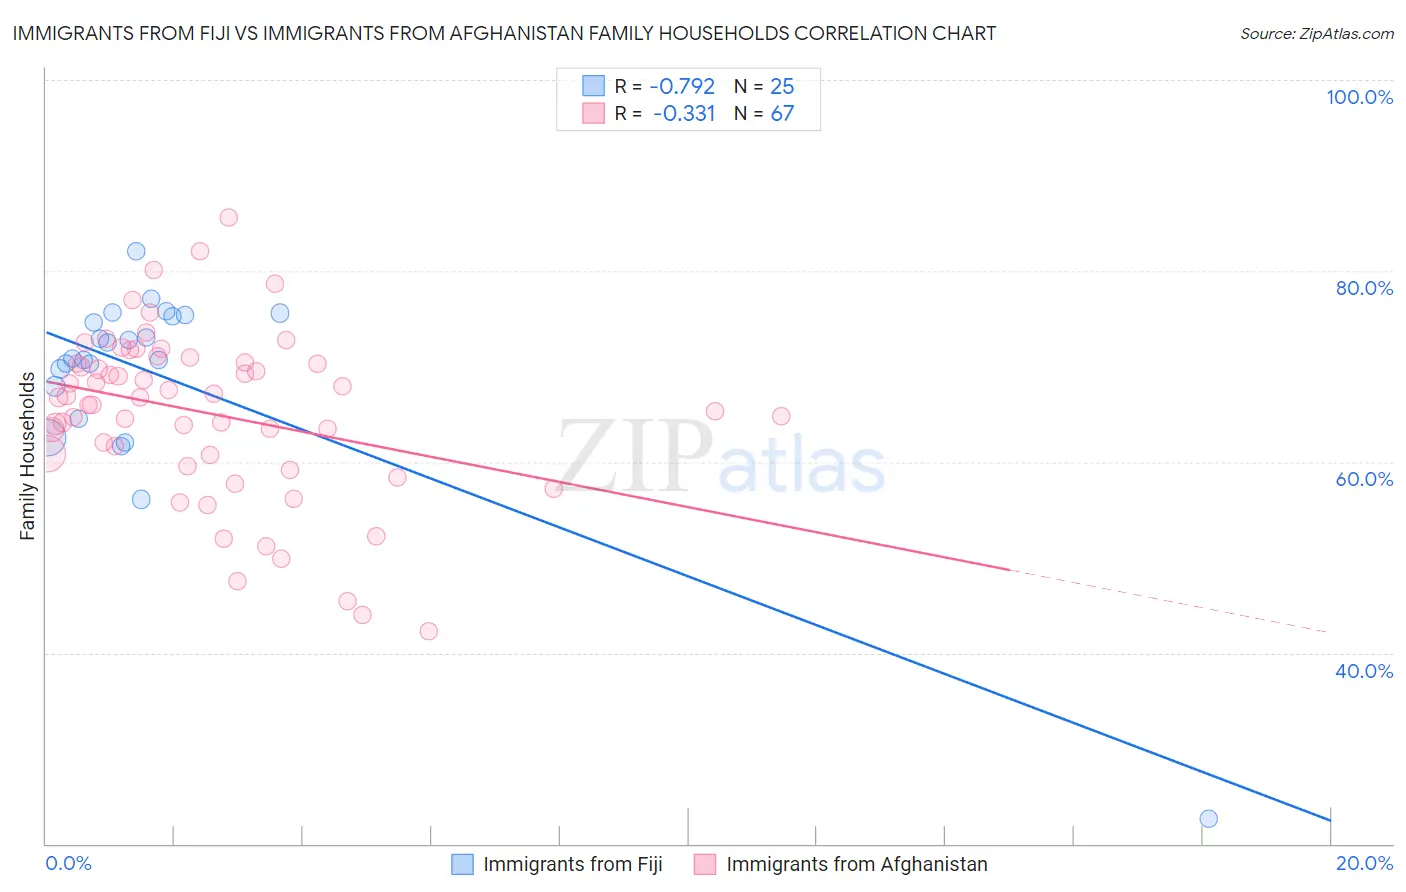
Immigrants from Fiji vs Immigrants from Afghanistan Family Households Correlation Chart
The statistical analysis conducted on geographies consisting of 93,754,900 people shows a strong negative correlation between the proportion of Immigrants from Fiji and percentage of family households in the United States with a correlation coefficient (R) of -0.792 and weighted average of 68.8%. Similarly, the statistical analysis conducted on geographies consisting of 147,637,809 people shows a mild negative correlation between the proportion of Immigrants from Afghanistan and percentage of family households in the United States with a correlation coefficient (R) of -0.331 and weighted average of 65.9%, a difference of 4.4%.
Family Households Correlation Summary
| Measurement | Immigrants from Fiji | Immigrants from Afghanistan |
| Minimum | 22.7% | 42.3% |
| Maximum | 82.1% | 85.6% |
| Range | 59.5% | 43.4% |
| Mean | 68.9% | 65.1% |
| Median | 70.8% | 66.8% |
| Interquartile 25% (IQ1) | 66.2% | 60.8% |
| Interquartile 75% (IQ3) | 75.3% | 70.4% |
| Interquartile Range (IQR) | 9.0% | 9.6% |
| Standard Deviation (Sample) | 11.2% | 8.8% |
| Standard Deviation (Population) | 11.0% | 8.7% |
Similar Demographics by Family Households
Demographics Similar to Immigrants from Fiji by Family Households
In terms of family households, the demographic groups most similar to Immigrants from Fiji are Mexican (69.0%, a difference of 0.32%), Immigrants from Mexico (69.1%, a difference of 0.53%), Native Hawaiian (68.4%, a difference of 0.56%), Immigrants from Philippines (68.3%, a difference of 0.63%), and Immigrants from Central America (68.3%, a difference of 0.70%).
| Demographics | Rating | Rank | Family Households |
| Yup'ik | 100 /100 | #1 | Exceptional 72.4% |
| Spanish American Indians | 100.0 /100 | #2 | Exceptional 71.2% |
| Tongans | 100.0 /100 | #3 | Exceptional 69.6% |
| Yakama | 100.0 /100 | #4 | Exceptional 69.3% |
| Yuman | 100.0 /100 | #5 | Exceptional 69.3% |
| Immigrants | Mexico | 100.0 /100 | #6 | Exceptional 69.1% |
| Mexicans | 100.0 /100 | #7 | Exceptional 69.0% |
| Immigrants | Fiji | 100.0 /100 | #8 | Exceptional 68.8% |
| Native Hawaiians | 100.0 /100 | #9 | Exceptional 68.4% |
| Immigrants | Philippines | 100.0 /100 | #10 | Exceptional 68.3% |
| Immigrants | Central America | 100.0 /100 | #11 | Exceptional 68.3% |
| Koreans | 100.0 /100 | #12 | Exceptional 68.3% |
| Pueblo | 100.0 /100 | #13 | Exceptional 68.2% |
| Immigrants | Cuba | 100.0 /100 | #14 | Exceptional 68.2% |
| Assyrians/Chaldeans/Syriacs | 100.0 /100 | #15 | Exceptional 68.2% |
Demographics Similar to Immigrants from Afghanistan by Family Households
In terms of family households, the demographic groups most similar to Immigrants from Afghanistan are Malaysian (65.9%, a difference of 0.010%), Bhutanese (65.9%, a difference of 0.020%), Japanese (65.9%, a difference of 0.040%), Fijian (65.9%, a difference of 0.060%), and Filipino (65.9%, a difference of 0.060%).
| Demographics | Rating | Rank | Family Households |
| Immigrants | Indonesia | 100.0 /100 | #63 | Exceptional 66.0% |
| Pima | 99.9 /100 | #64 | Exceptional 65.9% |
| Costa Ricans | 99.9 /100 | #65 | Exceptional 65.9% |
| Fijians | 99.9 /100 | #66 | Exceptional 65.9% |
| Filipinos | 99.9 /100 | #67 | Exceptional 65.9% |
| Japanese | 99.9 /100 | #68 | Exceptional 65.9% |
| Malaysians | 99.9 /100 | #69 | Exceptional 65.9% |
| Immigrants | Afghanistan | 99.9 /100 | #70 | Exceptional 65.9% |
| Bhutanese | 99.9 /100 | #71 | Exceptional 65.9% |
| Portuguese | 99.9 /100 | #72 | Exceptional 65.8% |
| Laotians | 99.9 /100 | #73 | Exceptional 65.8% |
| Burmese | 99.9 /100 | #74 | Exceptional 65.7% |
| Houma | 99.9 /100 | #75 | Exceptional 65.7% |
| Immigrants | Azores | 99.8 /100 | #76 | Exceptional 65.6% |
| Immigrants | South America | 99.8 /100 | #77 | Exceptional 65.6% |