Hopi vs Immigrants from Afghanistan Family Households
COMPARE
Hopi
Immigrants from Afghanistan
Family Households
Family Households Comparison
Hopi
Immigrants from Afghanistan
65.3%
FAMILY HOUSEHOLDS
98.8/ 100
METRIC RATING
92nd/ 347
METRIC RANK
65.9%
FAMILY HOUSEHOLDS
99.9/ 100
METRIC RATING
70th/ 347
METRIC RANK
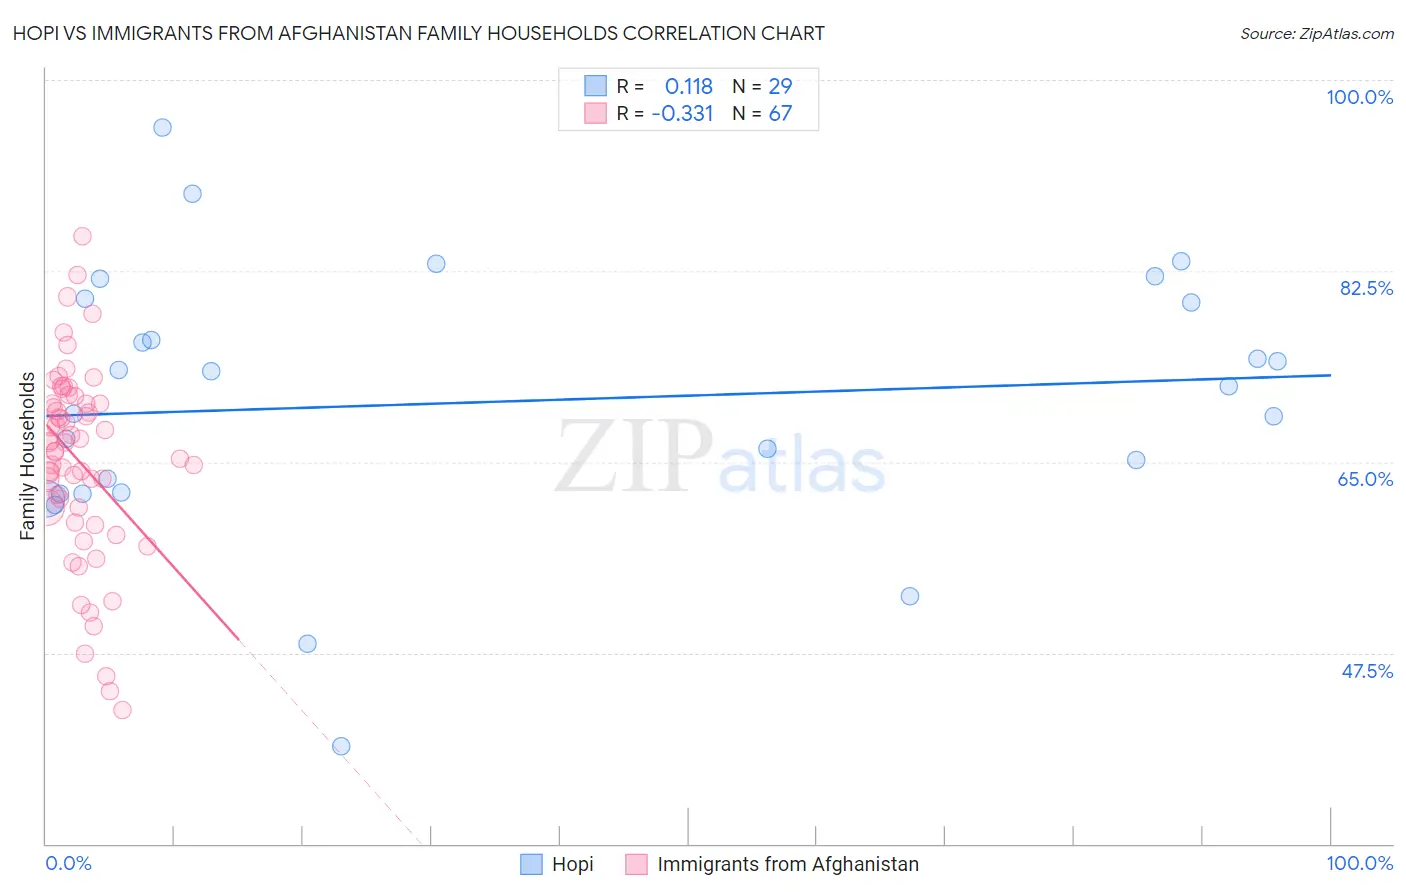
Hopi vs Immigrants from Afghanistan Family Households Correlation Chart
The statistical analysis conducted on geographies consisting of 74,733,485 people shows a poor positive correlation between the proportion of Hopi and percentage of family households in the United States with a correlation coefficient (R) of 0.118 and weighted average of 65.3%. Similarly, the statistical analysis conducted on geographies consisting of 147,637,809 people shows a mild negative correlation between the proportion of Immigrants from Afghanistan and percentage of family households in the United States with a correlation coefficient (R) of -0.331 and weighted average of 65.9%, a difference of 0.94%.
Family Households Correlation Summary
| Measurement | Hopi | Immigrants from Afghanistan |
| Minimum | 38.9% | 42.3% |
| Maximum | 95.7% | 85.6% |
| Range | 56.8% | 43.4% |
| Mean | 70.5% | 65.1% |
| Median | 72.0% | 66.8% |
| Interquartile 25% (IQ1) | 62.1% | 60.8% |
| Interquartile 75% (IQ3) | 79.8% | 70.4% |
| Interquartile Range (IQR) | 17.7% | 9.6% |
| Standard Deviation (Sample) | 12.2% | 8.8% |
| Standard Deviation (Population) | 12.0% | 8.7% |
Similar Demographics by Family Households
Demographics Similar to Hopi by Family Households
In terms of family households, the demographic groups most similar to Hopi are Guyanese (65.3%, a difference of 0.0%), Immigrants from Poland (65.2%, a difference of 0.020%), Crow (65.3%, a difference of 0.040%), Immigrants from Portugal (65.2%, a difference of 0.050%), and Swiss (65.2%, a difference of 0.050%).
| Demographics | Rating | Rank | Family Households |
| Immigrants | Cambodia | 99.5 /100 | #85 | Exceptional 65.4% |
| Egyptians | 99.4 /100 | #86 | Exceptional 65.4% |
| Immigrants | Egypt | 99.2 /100 | #87 | Exceptional 65.3% |
| Immigrants | Haiti | 99.1 /100 | #88 | Exceptional 65.3% |
| Immigrants | Caribbean | 99.1 /100 | #89 | Exceptional 65.3% |
| Immigrants | Laos | 99.1 /100 | #90 | Exceptional 65.3% |
| Crow | 98.9 /100 | #91 | Exceptional 65.3% |
| Hopi | 98.8 /100 | #92 | Exceptional 65.3% |
| Guyanese | 98.8 /100 | #93 | Exceptional 65.3% |
| Immigrants | Poland | 98.7 /100 | #94 | Exceptional 65.2% |
| Immigrants | Portugal | 98.6 /100 | #95 | Exceptional 65.2% |
| Swiss | 98.6 /100 | #96 | Exceptional 65.2% |
| Guatemalans | 98.6 /100 | #97 | Exceptional 65.2% |
| Immigrants | Syria | 98.4 /100 | #98 | Exceptional 65.2% |
| Central American Indians | 98.3 /100 | #99 | Exceptional 65.2% |
Demographics Similar to Immigrants from Afghanistan by Family Households
In terms of family households, the demographic groups most similar to Immigrants from Afghanistan are Malaysian (65.9%, a difference of 0.010%), Bhutanese (65.9%, a difference of 0.020%), Japanese (65.9%, a difference of 0.040%), Fijian (65.9%, a difference of 0.060%), and Filipino (65.9%, a difference of 0.060%).
| Demographics | Rating | Rank | Family Households |
| Immigrants | Indonesia | 100.0 /100 | #63 | Exceptional 66.0% |
| Pima | 99.9 /100 | #64 | Exceptional 65.9% |
| Costa Ricans | 99.9 /100 | #65 | Exceptional 65.9% |
| Fijians | 99.9 /100 | #66 | Exceptional 65.9% |
| Filipinos | 99.9 /100 | #67 | Exceptional 65.9% |
| Japanese | 99.9 /100 | #68 | Exceptional 65.9% |
| Malaysians | 99.9 /100 | #69 | Exceptional 65.9% |
| Immigrants | Afghanistan | 99.9 /100 | #70 | Exceptional 65.9% |
| Bhutanese | 99.9 /100 | #71 | Exceptional 65.9% |
| Portuguese | 99.9 /100 | #72 | Exceptional 65.8% |
| Laotians | 99.9 /100 | #73 | Exceptional 65.8% |
| Burmese | 99.9 /100 | #74 | Exceptional 65.7% |
| Houma | 99.9 /100 | #75 | Exceptional 65.7% |
| Immigrants | Azores | 99.8 /100 | #76 | Exceptional 65.6% |
| Immigrants | South America | 99.8 /100 | #77 | Exceptional 65.6% |