Immigrants from Western Europe vs Argentinean Family Households
COMPARE
Immigrants from Western Europe
Argentinean
Family Households
Family Households Comparison
Immigrants from Western Europe
Argentineans
63.2%
FAMILY HOUSEHOLDS
0.6/ 100
METRIC RATING
259th/ 347
METRIC RANK
65.0%
FAMILY HOUSEHOLDS
95.7/ 100
METRIC RATING
114th/ 347
METRIC RANK
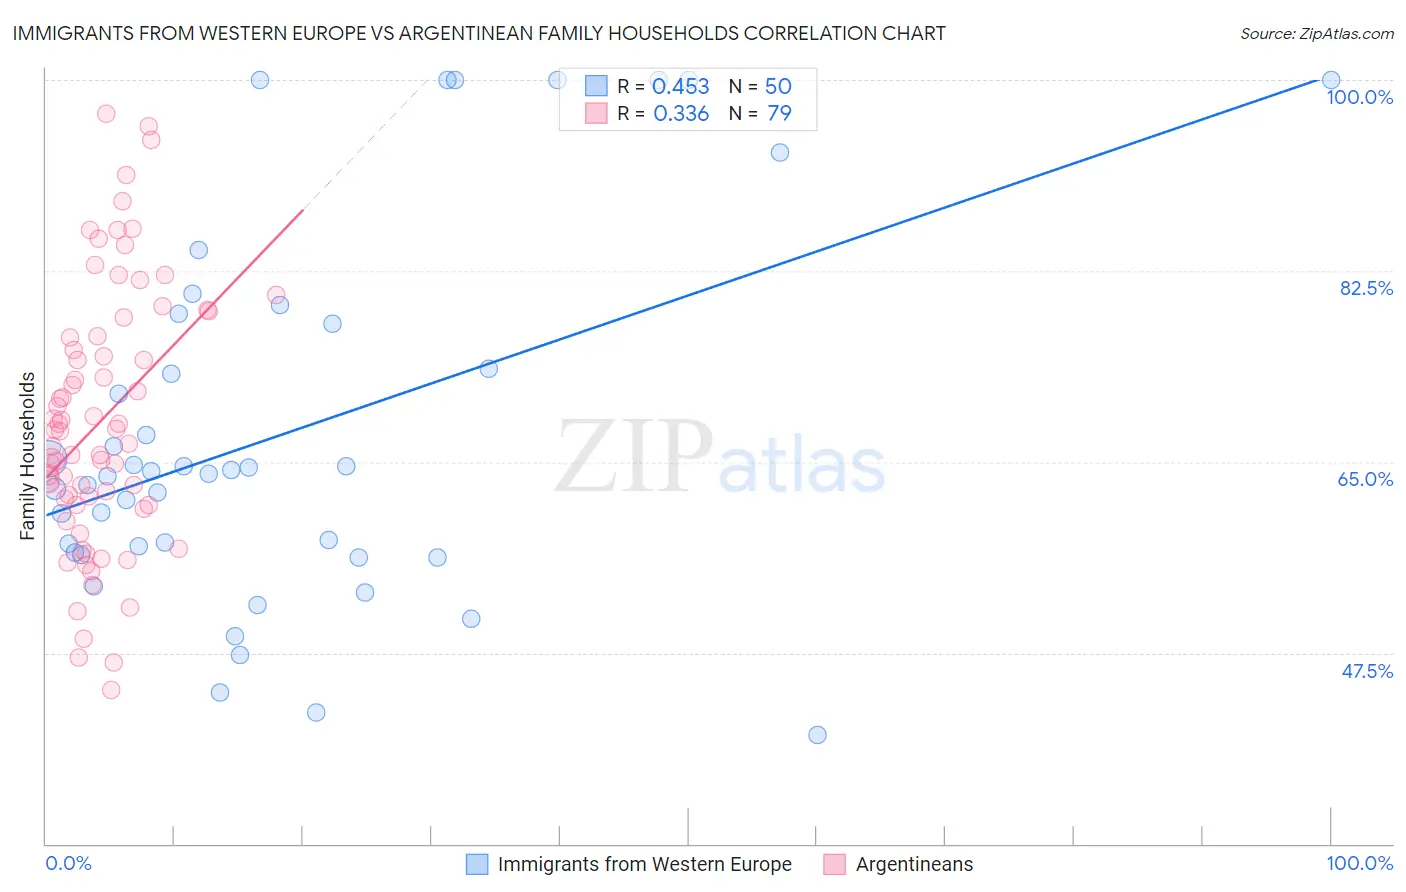
Immigrants from Western Europe vs Argentinean Family Households Correlation Chart
The statistical analysis conducted on geographies consisting of 493,828,314 people shows a moderate positive correlation between the proportion of Immigrants from Western Europe and percentage of family households in the United States with a correlation coefficient (R) of 0.453 and weighted average of 63.2%. Similarly, the statistical analysis conducted on geographies consisting of 296,998,100 people shows a mild positive correlation between the proportion of Argentineans and percentage of family households in the United States with a correlation coefficient (R) of 0.336 and weighted average of 65.0%, a difference of 2.8%.
Family Households Correlation Summary
| Measurement | Immigrants from Western Europe | Argentinean |
| Minimum | 40.0% | 44.1% |
| Maximum | 100.0% | 96.9% |
| Range | 60.0% | 52.8% |
| Mean | 67.6% | 68.8% |
| Median | 64.0% | 67.8% |
| Interquartile 25% (IQ1) | 56.7% | 61.1% |
| Interquartile 75% (IQ3) | 77.7% | 76.5% |
| Interquartile Range (IQR) | 21.0% | 15.4% |
| Standard Deviation (Sample) | 16.8% | 11.9% |
| Standard Deviation (Population) | 16.6% | 11.8% |
Similar Demographics by Family Households
Demographics Similar to Immigrants from Western Europe by Family Households
In terms of family households, the demographic groups most similar to Immigrants from Western Europe are Immigrants from Barbados (63.2%, a difference of 0.010%), Cypriot (63.2%, a difference of 0.020%), Immigrants from Russia (63.2%, a difference of 0.040%), Immigrants from Ireland (63.2%, a difference of 0.050%), and Icelander (63.3%, a difference of 0.070%).
| Demographics | Rating | Rank | Family Households |
| Bahamians | 1.1 /100 | #252 | Tragic 63.3% |
| Immigrants | Dominican Republic | 1.0 /100 | #253 | Tragic 63.3% |
| Slovaks | 1.0 /100 | #254 | Tragic 63.3% |
| Potawatomi | 1.0 /100 | #255 | Tragic 63.3% |
| Luxembourgers | 0.9 /100 | #256 | Tragic 63.3% |
| Icelanders | 0.8 /100 | #257 | Tragic 63.3% |
| Immigrants | Barbados | 0.7 /100 | #258 | Tragic 63.2% |
| Immigrants | Western Europe | 0.6 /100 | #259 | Tragic 63.2% |
| Cypriots | 0.6 /100 | #260 | Tragic 63.2% |
| Immigrants | Russia | 0.6 /100 | #261 | Tragic 63.2% |
| Immigrants | Ireland | 0.6 /100 | #262 | Tragic 63.2% |
| Cheyenne | 0.5 /100 | #263 | Tragic 63.2% |
| Kenyans | 0.5 /100 | #264 | Tragic 63.2% |
| Colville | 0.5 /100 | #265 | Tragic 63.2% |
| Immigrants | Western Africa | 0.5 /100 | #266 | Tragic 63.1% |
Demographics Similar to Argentineans by Family Households
In terms of family households, the demographic groups most similar to Argentineans are Ecuadorian (65.0%, a difference of 0.030%), Immigrants from Iraq (65.0%, a difference of 0.030%), Cherokee (65.0%, a difference of 0.030%), Spanish (65.0%, a difference of 0.040%), and Dutch (64.9%, a difference of 0.050%).
| Demographics | Rating | Rank | Family Households |
| Alaska Natives | 97.3 /100 | #107 | Exceptional 65.1% |
| Palestinians | 97.2 /100 | #108 | Exceptional 65.1% |
| Immigrants | Guatemala | 96.9 /100 | #109 | Exceptional 65.0% |
| Scandinavians | 96.8 /100 | #110 | Exceptional 65.0% |
| Europeans | 96.8 /100 | #111 | Exceptional 65.0% |
| Immigrants | Jordan | 96.5 /100 | #112 | Exceptional 65.0% |
| Spanish | 96.2 /100 | #113 | Exceptional 65.0% |
| Argentineans | 95.7 /100 | #114 | Exceptional 65.0% |
| Ecuadorians | 95.4 /100 | #115 | Exceptional 65.0% |
| Immigrants | Iraq | 95.4 /100 | #116 | Exceptional 65.0% |
| Cherokee | 95.3 /100 | #117 | Exceptional 65.0% |
| Dutch | 95.1 /100 | #118 | Exceptional 64.9% |
| Immigrants | Eastern Asia | 94.4 /100 | #119 | Exceptional 64.9% |
| Immigrants | Oceania | 94.2 /100 | #120 | Exceptional 64.9% |
| Hungarians | 94.0 /100 | #121 | Exceptional 64.9% |