Immigrants from Ethiopia vs Argentinean Births to Unmarried Women
COMPARE
Immigrants from Ethiopia
Argentinean
Births to Unmarried Women
Births to Unmarried Women Comparison
Immigrants from Ethiopia
Argentineans
29.7%
BIRTHS TO UNMARRIED WOMEN
93.4/ 100
METRIC RATING
110th/ 347
METRIC RANK
30.0%
BIRTHS TO UNMARRIED WOMEN
90.5/ 100
METRIC RATING
119th/ 347
METRIC RANK
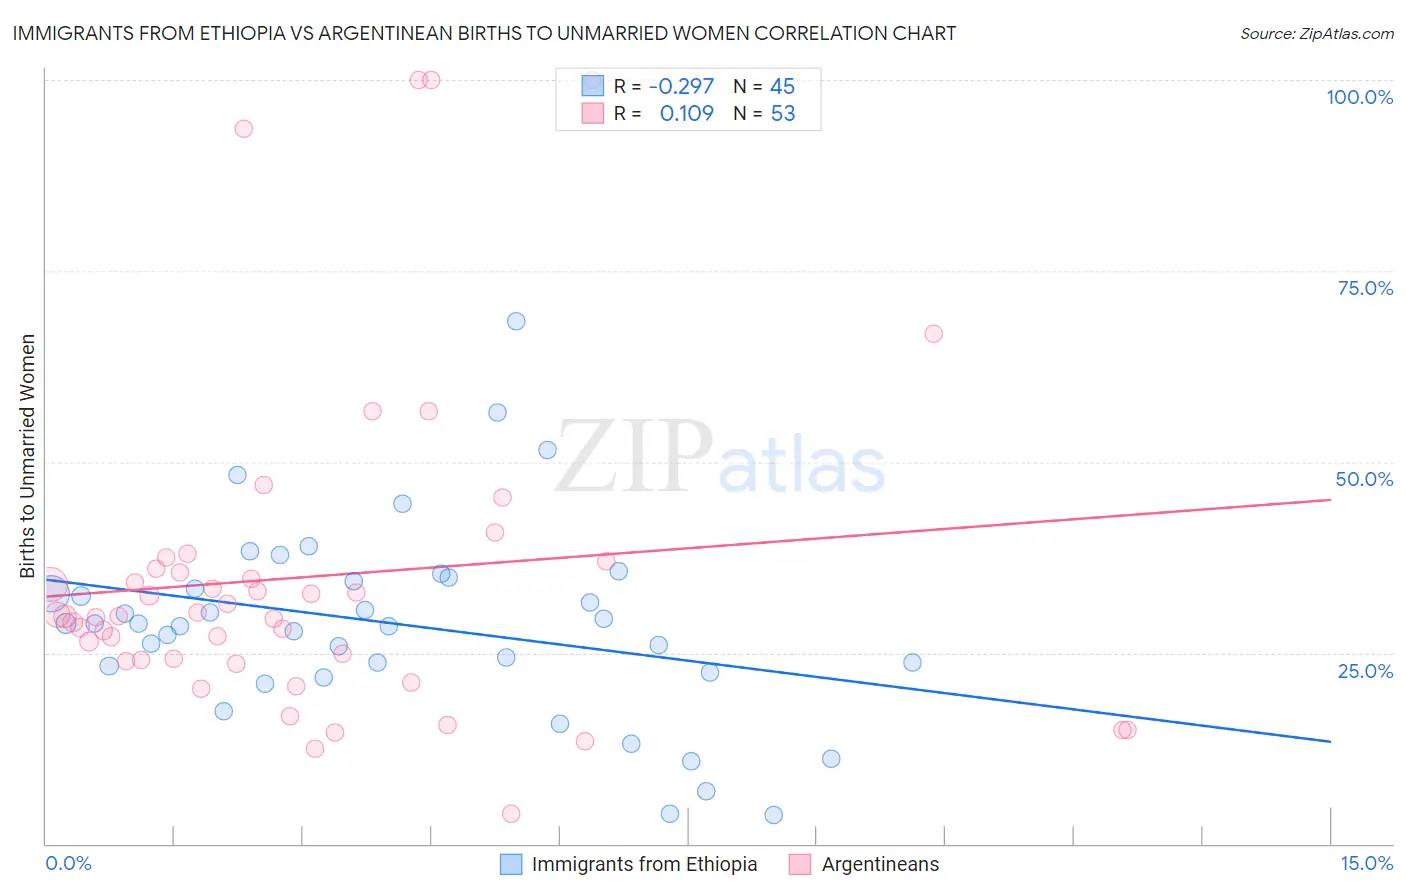
Immigrants from Ethiopia vs Argentinean Births to Unmarried Women Correlation Chart
The statistical analysis conducted on geographies consisting of 204,461,037 people shows a weak negative correlation between the proportion of Immigrants from Ethiopia and percentage of births to unmarried women in the United States with a correlation coefficient (R) of -0.297 and weighted average of 29.7%. Similarly, the statistical analysis conducted on geographies consisting of 280,462,153 people shows a poor positive correlation between the proportion of Argentineans and percentage of births to unmarried women in the United States with a correlation coefficient (R) of 0.109 and weighted average of 30.0%, a difference of 0.97%.
Births to Unmarried Women Correlation Summary
| Measurement | Immigrants from Ethiopia | Argentinean |
| Minimum | 3.7% | 4.0% |
| Maximum | 68.3% | 100.0% |
| Range | 64.6% | 96.0% |
| Mean | 28.8% | 34.9% |
| Median | 28.8% | 29.9% |
| Interquartile 25% (IQ1) | 22.8% | 24.0% |
| Interquartile 75% (IQ3) | 34.7% | 36.5% |
| Interquartile Range (IQR) | 11.8% | 12.5% |
| Standard Deviation (Sample) | 12.8% | 21.5% |
| Standard Deviation (Population) | 12.6% | 21.3% |
Demographics Similar to Immigrants from Ethiopia and Argentineans by Births to Unmarried Women
In terms of births to unmarried women, the demographic groups most similar to Immigrants from Ethiopia are Greek (29.7%, a difference of 0.030%), Paraguayan (29.7%, a difference of 0.070%), Immigrants from Hungary (29.7%, a difference of 0.14%), Immigrants from Brazil (29.6%, a difference of 0.15%), and Basque (29.7%, a difference of 0.15%). Similarly, the demographic groups most similar to Argentineans are Immigrants from Norway (29.9%, a difference of 0.14%), Immigrants from Netherlands (29.9%, a difference of 0.16%), Ugandan (30.1%, a difference of 0.36%), Immigrants from Italy (29.9%, a difference of 0.37%), and Korean (30.1%, a difference of 0.44%).
| Demographics | Rating | Rank | Births to Unmarried Women |
| Lithuanians | 94.4 /100 | #104 | Exceptional 29.6% |
| Immigrants | Nepal | 94.3 /100 | #105 | Exceptional 29.6% |
| Swedes | 93.8 /100 | #106 | Exceptional 29.6% |
| Immigrants | Brazil | 93.7 /100 | #107 | Exceptional 29.6% |
| Paraguayans | 93.5 /100 | #108 | Exceptional 29.7% |
| Greeks | 93.4 /100 | #109 | Exceptional 29.7% |
| Immigrants | Ethiopia | 93.4 /100 | #110 | Exceptional 29.7% |
| Immigrants | Hungary | 93.0 /100 | #111 | Exceptional 29.7% |
| Basques | 93.0 /100 | #112 | Exceptional 29.7% |
| Scandinavians | 92.7 /100 | #113 | Exceptional 29.8% |
| Immigrants | Croatia | 92.6 /100 | #114 | Exceptional 29.8% |
| Ethiopians | 91.9 /100 | #115 | Exceptional 29.8% |
| Immigrants | Italy | 91.7 /100 | #116 | Exceptional 29.9% |
| Immigrants | Netherlands | 91.1 /100 | #117 | Exceptional 29.9% |
| Immigrants | Norway | 91.0 /100 | #118 | Exceptional 29.9% |
| Argentineans | 90.5 /100 | #119 | Exceptional 30.0% |
| Ugandans | 89.2 /100 | #120 | Excellent 30.1% |
| Koreans | 88.9 /100 | #121 | Excellent 30.1% |
| Immigrants | Argentina | 88.7 /100 | #122 | Excellent 30.1% |
| Syrians | 88.2 /100 | #123 | Excellent 30.2% |
| Croatians | 88.0 /100 | #124 | Excellent 30.2% |