Carpatho Rusyn vs Immigrants from Hong Kong Currently Married
COMPARE
Carpatho Rusyn
Immigrants from Hong Kong
Currently Married
Currently Married Comparison
Carpatho Rusyns
Immigrants from Hong Kong
47.0%
CURRENTLY MARRIED
72.6/ 100
METRIC RATING
146th/ 347
METRIC RANK
48.9%
CURRENTLY MARRIED
99.5/ 100
METRIC RATING
32nd/ 347
METRIC RANK
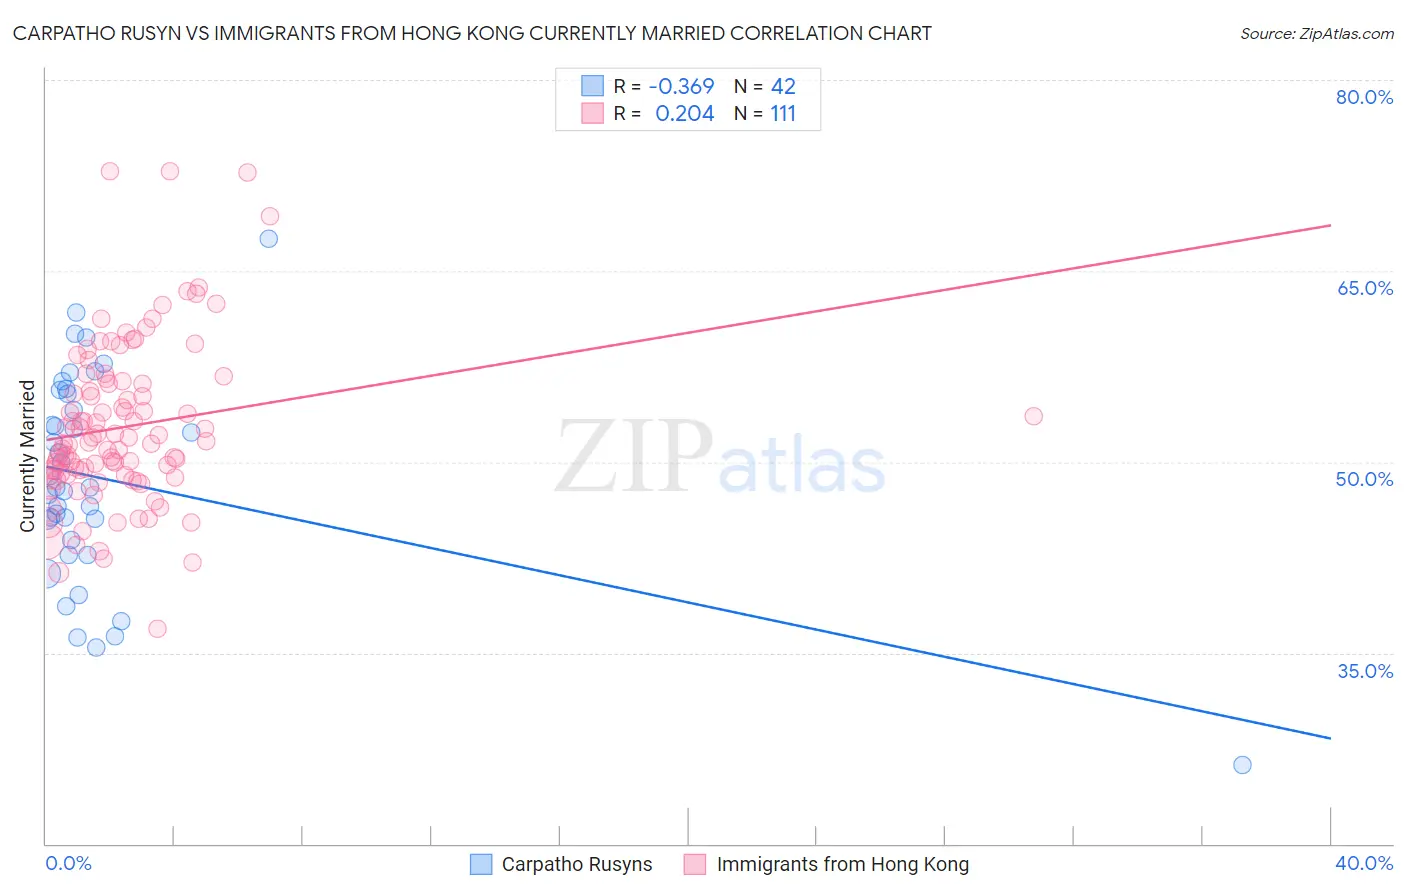
Carpatho Rusyn vs Immigrants from Hong Kong Currently Married Correlation Chart
The statistical analysis conducted on geographies consisting of 58,871,690 people shows a mild negative correlation between the proportion of Carpatho Rusyns and percentage of population currently married in the United States with a correlation coefficient (R) of -0.369 and weighted average of 47.0%. Similarly, the statistical analysis conducted on geographies consisting of 253,978,076 people shows a weak positive correlation between the proportion of Immigrants from Hong Kong and percentage of population currently married in the United States with a correlation coefficient (R) of 0.204 and weighted average of 48.9%, a difference of 3.9%.
Currently Married Correlation Summary
| Measurement | Carpatho Rusyn | Immigrants from Hong Kong |
| Minimum | 26.2% | 36.9% |
| Maximum | 67.5% | 72.8% |
| Range | 41.3% | 35.9% |
| Mean | 48.6% | 52.7% |
| Median | 48.0% | 51.5% |
| Interquartile 25% (IQ1) | 43.8% | 49.0% |
| Interquartile 75% (IQ3) | 55.3% | 56.1% |
| Interquartile Range (IQR) | 11.5% | 7.1% |
| Standard Deviation (Sample) | 8.3% | 6.4% |
| Standard Deviation (Population) | 8.2% | 6.4% |
Similar Demographics by Currently Married
Demographics Similar to Carpatho Rusyns by Currently Married
In terms of currently married, the demographic groups most similar to Carpatho Rusyns are Immigrants from South Eastern Asia (47.1%, a difference of 0.010%), Immigrants from Argentina (47.0%, a difference of 0.030%), Hmong (47.1%, a difference of 0.040%), Guamanian/Chamorro (47.1%, a difference of 0.070%), and Venezuelan (47.1%, a difference of 0.080%).
| Demographics | Rating | Rank | Currently Married |
| Yugoslavians | 77.4 /100 | #139 | Good 47.2% |
| Cajuns | 75.3 /100 | #140 | Good 47.1% |
| Venezuelans | 74.4 /100 | #141 | Good 47.1% |
| Argentineans | 74.4 /100 | #142 | Good 47.1% |
| Guamanians/Chamorros | 74.2 /100 | #143 | Good 47.1% |
| Hmong | 73.4 /100 | #144 | Good 47.1% |
| Immigrants | South Eastern Asia | 72.9 /100 | #145 | Good 47.1% |
| Carpatho Rusyns | 72.6 /100 | #146 | Good 47.0% |
| Immigrants | Argentina | 72.0 /100 | #147 | Good 47.0% |
| Cambodians | 70.4 /100 | #148 | Good 47.0% |
| Zimbabweans | 70.1 /100 | #149 | Good 47.0% |
| Immigrants | Turkey | 70.0 /100 | #150 | Good 47.0% |
| Chileans | 69.8 /100 | #151 | Good 47.0% |
| Immigrants | Serbia | 68.8 /100 | #152 | Good 47.0% |
| Immigrants | Venezuela | 68.6 /100 | #153 | Good 47.0% |
Demographics Similar to Immigrants from Hong Kong by Currently Married
In terms of currently married, the demographic groups most similar to Immigrants from Hong Kong are Eastern European (48.9%, a difference of 0.010%), Polish (48.9%, a difference of 0.010%), Croatian (48.9%, a difference of 0.020%), Irish (48.9%, a difference of 0.040%), and Welsh (48.9%, a difference of 0.070%).
| Demographics | Rating | Rank | Currently Married |
| Maltese | 99.6 /100 | #25 | Exceptional 49.0% |
| Immigrants | Korea | 99.6 /100 | #26 | Exceptional 49.0% |
| Burmese | 99.6 /100 | #27 | Exceptional 48.9% |
| Welsh | 99.5 /100 | #28 | Exceptional 48.9% |
| Croatians | 99.5 /100 | #29 | Exceptional 48.9% |
| Eastern Europeans | 99.5 /100 | #30 | Exceptional 48.9% |
| Poles | 99.5 /100 | #31 | Exceptional 48.9% |
| Immigrants | Hong Kong | 99.5 /100 | #32 | Exceptional 48.9% |
| Irish | 99.5 /100 | #33 | Exceptional 48.9% |
| Immigrants | Lithuania | 99.4 /100 | #34 | Exceptional 48.8% |
| Immigrants | Northern Europe | 99.4 /100 | #35 | Exceptional 48.8% |
| Italians | 99.4 /100 | #36 | Exceptional 48.8% |
| Hungarians | 99.4 /100 | #37 | Exceptional 48.8% |
| Czechoslovakians | 99.4 /100 | #38 | Exceptional 48.8% |
| British | 99.4 /100 | #39 | Exceptional 48.8% |