Immigrants from Costa Rica vs Liberian Family Households with Children
COMPARE
Immigrants from Costa Rica
Liberian
Family Households with Children
Family Households with Children Comparison
Immigrants from Costa Rica
Liberians
28.3%
FAMILY HOUSEHOLDS WITH CHILDREN
99.6/ 100
METRIC RATING
89th/ 347
METRIC RANK
28.3%
FAMILY HOUSEHOLDS WITH CHILDREN
99.6/ 100
METRIC RATING
88th/ 347
METRIC RANK
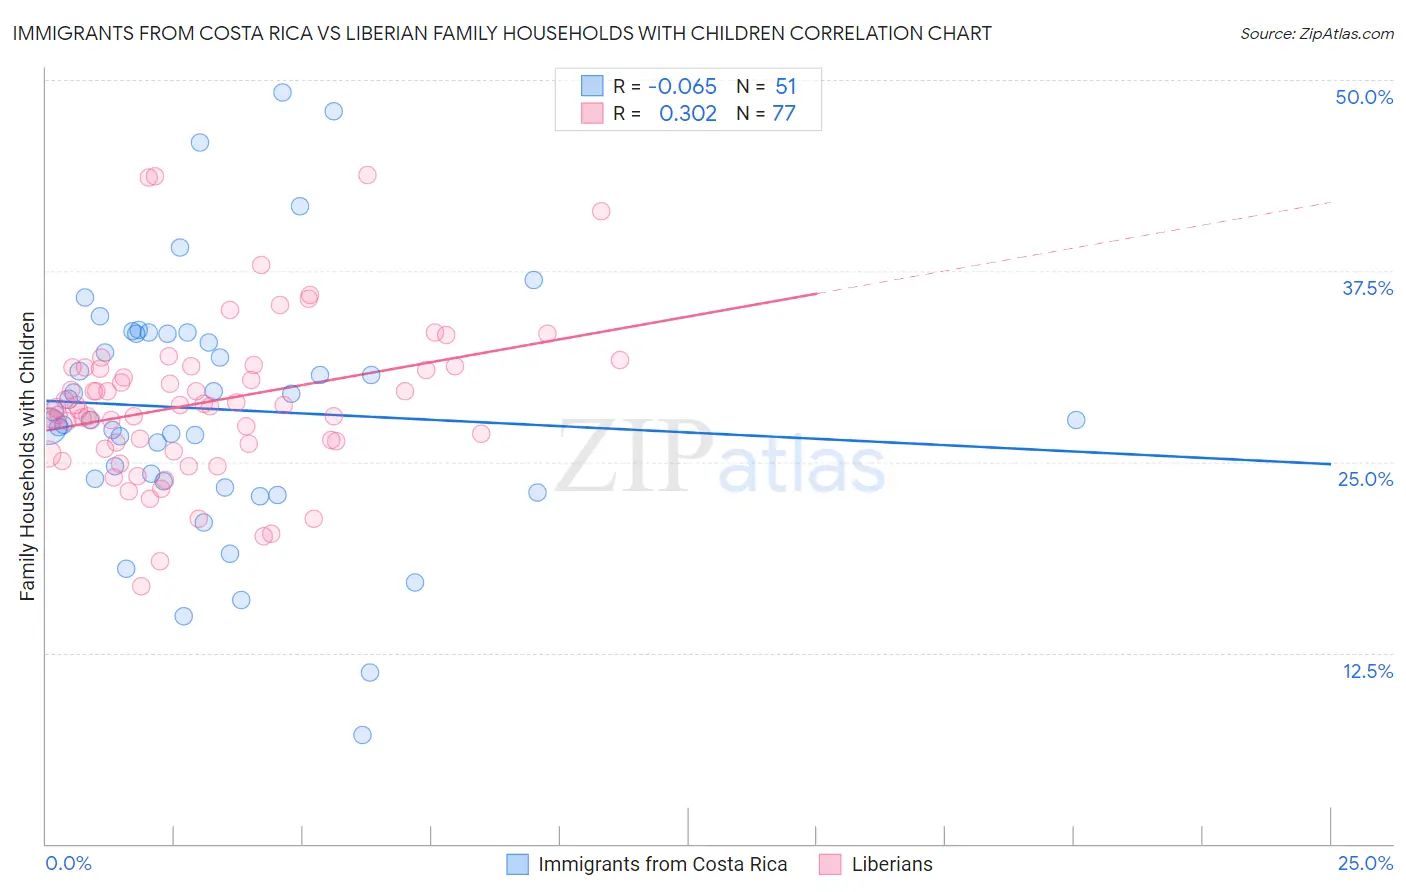
Immigrants from Costa Rica vs Liberian Family Households with Children Correlation Chart
The statistical analysis conducted on geographies consisting of 204,199,597 people shows a slight negative correlation between the proportion of Immigrants from Costa Rica and percentage of family households with children in the United States with a correlation coefficient (R) of -0.065 and weighted average of 28.3%. Similarly, the statistical analysis conducted on geographies consisting of 118,011,319 people shows a mild positive correlation between the proportion of Liberians and percentage of family households with children in the United States with a correlation coefficient (R) of 0.302 and weighted average of 28.3%, a difference of 0.010%.
Family Households with Children Correlation Summary
| Measurement | Immigrants from Costa Rica | Liberian |
| Minimum | 7.1% | 16.9% |
| Maximum | 49.2% | 43.8% |
| Range | 42.0% | 27.0% |
| Mean | 28.5% | 28.9% |
| Median | 27.7% | 28.7% |
| Interquartile 25% (IQ1) | 23.7% | 26.0% |
| Interquartile 75% (IQ3) | 33.4% | 31.2% |
| Interquartile Range (IQR) | 9.7% | 5.1% |
| Standard Deviation (Sample) | 8.3% | 5.2% |
| Standard Deviation (Population) | 8.2% | 5.2% |
Demographics Similar to Immigrants from Costa Rica and Liberians by Family Households with Children
In terms of family households with children, the demographic groups most similar to Immigrants from Costa Rica are Colombian (28.3%, a difference of 0.020%), Immigrants from Western Africa (28.3%, a difference of 0.080%), Immigrants from Thailand (28.2%, a difference of 0.10%), Immigrants from Liberia (28.2%, a difference of 0.16%), and Chickasaw (28.2%, a difference of 0.18%). Similarly, the demographic groups most similar to Liberians are Colombian (28.3%, a difference of 0.010%), Immigrants from Western Africa (28.3%, a difference of 0.070%), Immigrants from Thailand (28.2%, a difference of 0.11%), Immigrants from Liberia (28.2%, a difference of 0.16%), and Chickasaw (28.2%, a difference of 0.19%).
| Demographics | Rating | Rank | Family Households with Children |
| Immigrants | Nepal | 99.8 /100 | #78 | Exceptional 28.4% |
| Immigrants | Iraq | 99.8 /100 | #79 | Exceptional 28.4% |
| Natives/Alaskans | 99.8 /100 | #80 | Exceptional 28.4% |
| South Americans | 99.8 /100 | #81 | Exceptional 28.4% |
| Kenyans | 99.8 /100 | #82 | Exceptional 28.4% |
| Nicaraguans | 99.8 /100 | #83 | Exceptional 28.4% |
| Costa Ricans | 99.8 /100 | #84 | Exceptional 28.4% |
| Immigrants | Syria | 99.8 /100 | #85 | Exceptional 28.4% |
| Immigrants | Western Africa | 99.6 /100 | #86 | Exceptional 28.3% |
| Colombians | 99.6 /100 | #87 | Exceptional 28.3% |
| Liberians | 99.6 /100 | #88 | Exceptional 28.3% |
| Immigrants | Costa Rica | 99.6 /100 | #89 | Exceptional 28.3% |
| Immigrants | Thailand | 99.5 /100 | #90 | Exceptional 28.2% |
| Immigrants | Liberia | 99.4 /100 | #91 | Exceptional 28.2% |
| Chickasaw | 99.4 /100 | #92 | Exceptional 28.2% |
| Panamanians | 99.3 /100 | #93 | Exceptional 28.2% |
| Immigrants | Colombia | 99.2 /100 | #94 | Exceptional 28.2% |
| Immigrants | Nicaragua | 99.1 /100 | #95 | Exceptional 28.2% |
| Ute | 99.1 /100 | #96 | Exceptional 28.2% |
| Chileans | 98.9 /100 | #97 | Exceptional 28.1% |
| Immigrants | Kenya | 98.9 /100 | #98 | Exceptional 28.1% |