Immigrants from Costa Rica vs Cree Currently Married
COMPARE
Immigrants from Costa Rica
Cree
Currently Married
Currently Married Comparison
Immigrants from Costa Rica
Cree
46.0%
CURRENTLY MARRIED
19.6/ 100
METRIC RATING
199th/ 347
METRIC RANK
44.9%
CURRENTLY MARRIED
1.7/ 100
METRIC RATING
229th/ 347
METRIC RANK
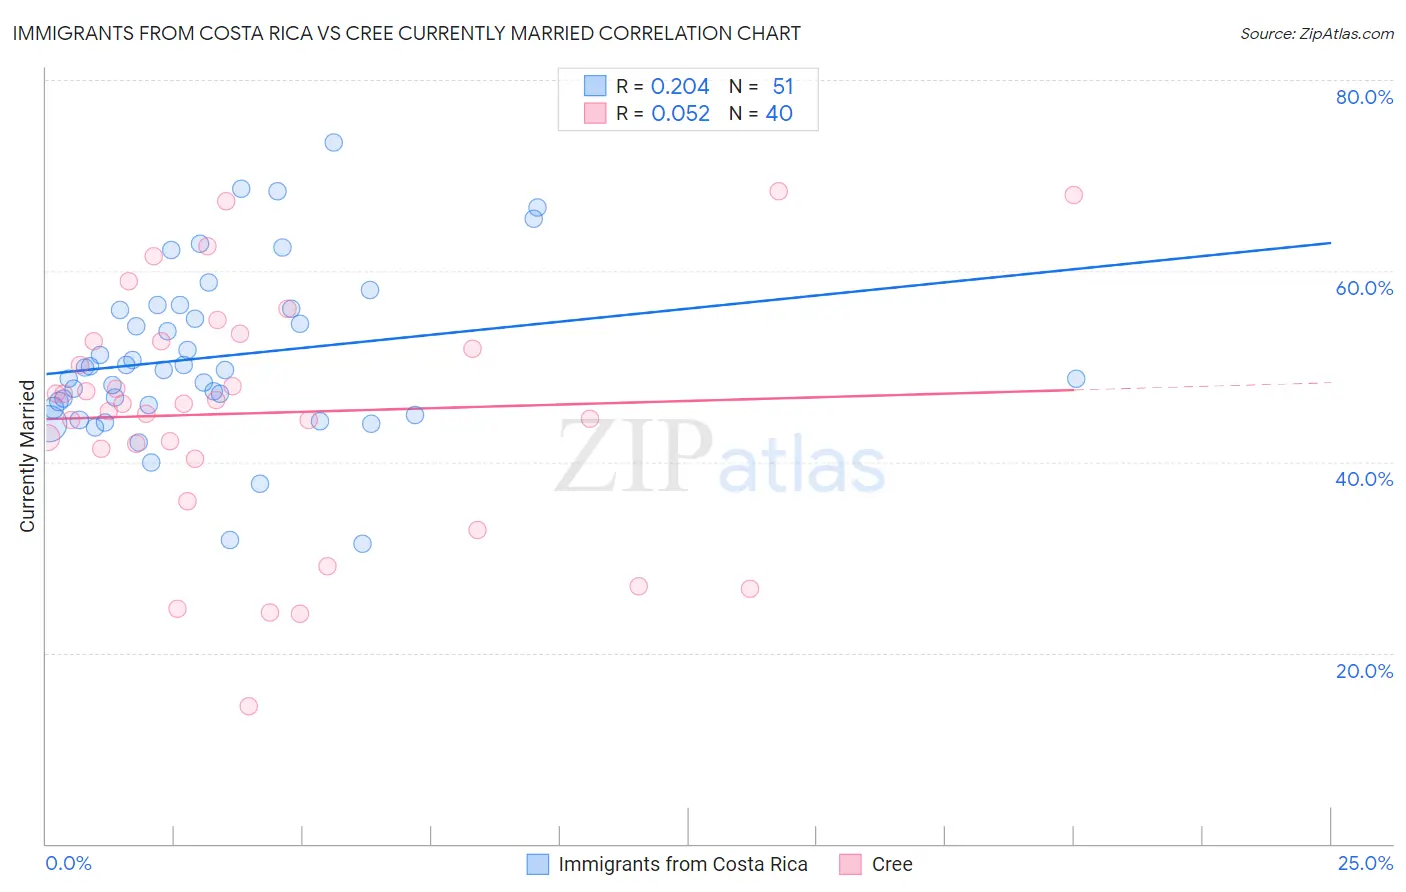
Immigrants from Costa Rica vs Cree Currently Married Correlation Chart
The statistical analysis conducted on geographies consisting of 204,268,650 people shows a weak positive correlation between the proportion of Immigrants from Costa Rica and percentage of population currently married in the United States with a correlation coefficient (R) of 0.204 and weighted average of 46.0%. Similarly, the statistical analysis conducted on geographies consisting of 76,211,685 people shows a slight positive correlation between the proportion of Cree and percentage of population currently married in the United States with a correlation coefficient (R) of 0.052 and weighted average of 44.9%, a difference of 2.5%.
Currently Married Correlation Summary
| Measurement | Immigrants from Costa Rica | Cree |
| Minimum | 31.4% | 14.4% |
| Maximum | 73.5% | 68.3% |
| Range | 42.1% | 53.9% |
| Mean | 51.0% | 45.1% |
| Median | 49.7% | 46.1% |
| Interquartile 25% (IQ1) | 45.7% | 40.8% |
| Interquartile 75% (IQ3) | 56.1% | 52.6% |
| Interquartile Range (IQR) | 10.4% | 11.8% |
| Standard Deviation (Sample) | 8.8% | 12.7% |
| Standard Deviation (Population) | 8.7% | 12.5% |
Similar Demographics by Currently Married
Demographics Similar to Immigrants from Costa Rica by Currently Married
In terms of currently married, the demographic groups most similar to Immigrants from Costa Rica are Immigrants from Colombia (46.1%, a difference of 0.080%), Immigrants from Kuwait (46.1%, a difference of 0.12%), Creek (46.0%, a difference of 0.14%), Immigrants from Bosnia and Herzegovina (46.1%, a difference of 0.15%), and South American (46.1%, a difference of 0.23%).
| Demographics | Rating | Rank | Currently Married |
| Soviet Union | 25.7 /100 | #192 | Fair 46.2% |
| Immigrants | Fiji | 25.0 /100 | #193 | Fair 46.2% |
| South Americans | 23.8 /100 | #194 | Fair 46.1% |
| Immigrants | Nepal | 23.7 /100 | #195 | Fair 46.1% |
| Immigrants | Bosnia and Herzegovina | 22.2 /100 | #196 | Fair 46.1% |
| Immigrants | Kuwait | 21.7 /100 | #197 | Fair 46.1% |
| Immigrants | Colombia | 21.0 /100 | #198 | Fair 46.1% |
| Immigrants | Costa Rica | 19.6 /100 | #199 | Poor 46.0% |
| Creek | 17.2 /100 | #200 | Poor 46.0% |
| Malaysians | 15.3 /100 | #201 | Poor 45.9% |
| Immigrants | Albania | 14.5 /100 | #202 | Poor 45.9% |
| Taiwanese | 11.7 /100 | #203 | Poor 45.8% |
| Immigrants | Spain | 11.6 /100 | #204 | Poor 45.8% |
| South American Indians | 11.5 /100 | #205 | Poor 45.8% |
| Immigrants | Immigrants | 11.2 /100 | #206 | Poor 45.8% |
Demographics Similar to Cree by Currently Married
In terms of currently married, the demographic groups most similar to Cree are Immigrants from Kenya (44.9%, a difference of 0.040%), Immigrants from Panama (44.9%, a difference of 0.080%), Spanish American (45.0%, a difference of 0.19%), Immigrants from Uruguay (45.0%, a difference of 0.19%), and Comanche (45.0%, a difference of 0.20%).
| Demographics | Rating | Rank | Currently Married |
| Immigrants | Azores | 2.5 /100 | #222 | Tragic 45.1% |
| Immigrants | Laos | 2.3 /100 | #223 | Tragic 45.0% |
| Immigrants | Uganda | 2.2 /100 | #224 | Tragic 45.0% |
| French American Indians | 2.2 /100 | #225 | Tragic 45.0% |
| Comanche | 2.1 /100 | #226 | Tragic 45.0% |
| Spanish Americans | 2.1 /100 | #227 | Tragic 45.0% |
| Immigrants | Uruguay | 2.0 /100 | #228 | Tragic 45.0% |
| Cree | 1.7 /100 | #229 | Tragic 44.9% |
| Immigrants | Kenya | 1.6 /100 | #230 | Tragic 44.9% |
| Immigrants | Panama | 1.5 /100 | #231 | Tragic 44.9% |
| Nepalese | 1.2 /100 | #232 | Tragic 44.7% |
| Immigrants | Saudi Arabia | 1.1 /100 | #233 | Tragic 44.7% |
| Iroquois | 1.1 /100 | #234 | Tragic 44.7% |
| Alaskan Athabascans | 0.9 /100 | #235 | Tragic 44.6% |
| Cubans | 0.9 /100 | #236 | Tragic 44.6% |