Immigrants from Congo vs African Family Households with Children
COMPARE
Immigrants from Congo
African
Family Households with Children
Family Households with Children Comparison
Immigrants from Congo
Africans
27.3%
FAMILY HOUSEHOLDS WITH CHILDREN
28.7/ 100
METRIC RATING
200th/ 347
METRIC RANK
27.2%
FAMILY HOUSEHOLDS WITH CHILDREN
13.0/ 100
METRIC RATING
214th/ 347
METRIC RANK
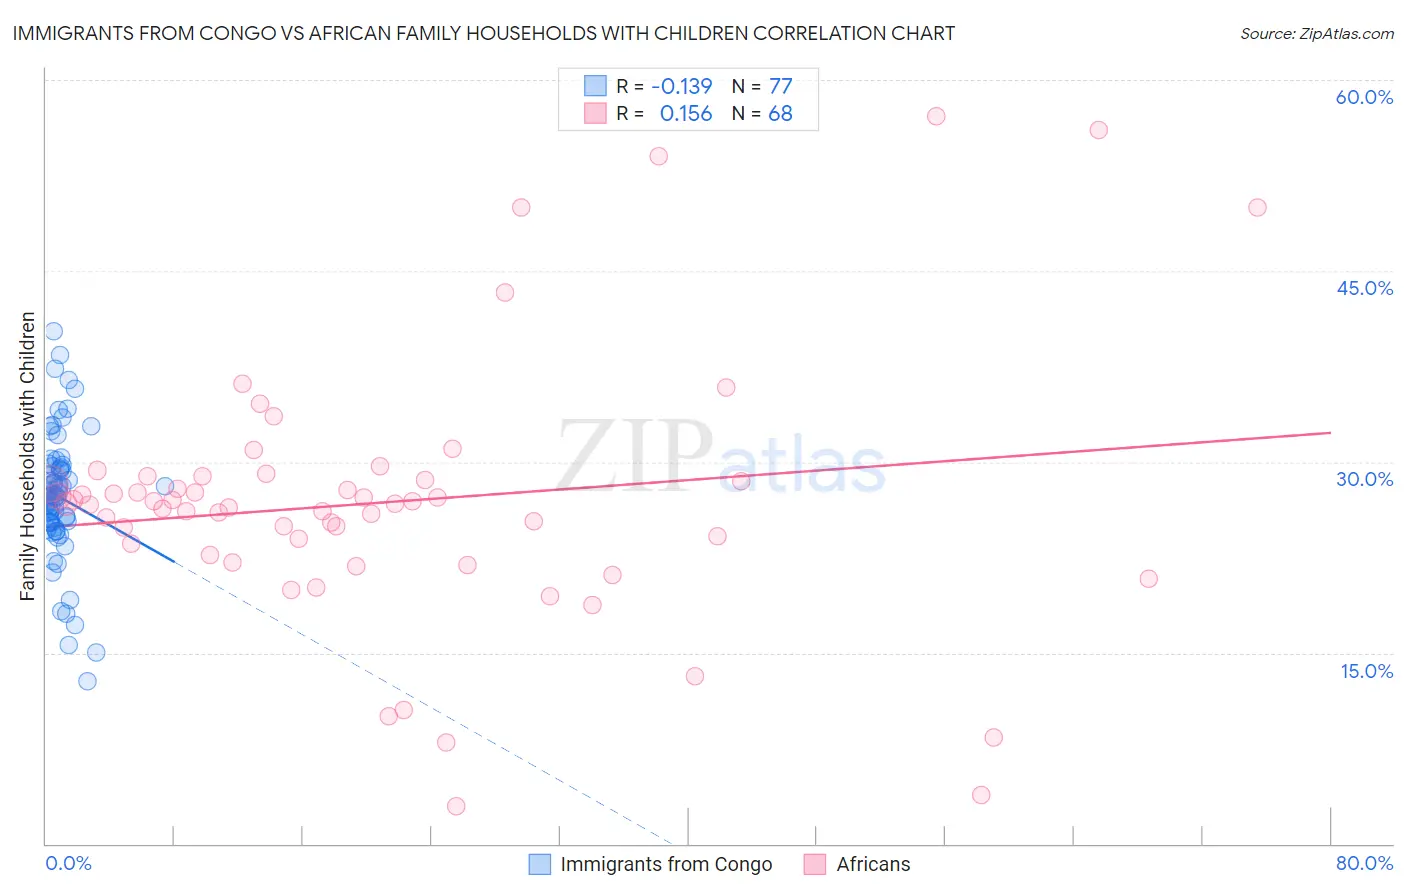
Immigrants from Congo vs African Family Households with Children Correlation Chart
The statistical analysis conducted on geographies consisting of 92,083,447 people shows a poor negative correlation between the proportion of Immigrants from Congo and percentage of family households with children in the United States with a correlation coefficient (R) of -0.139 and weighted average of 27.3%. Similarly, the statistical analysis conducted on geographies consisting of 469,417,507 people shows a poor positive correlation between the proportion of Africans and percentage of family households with children in the United States with a correlation coefficient (R) of 0.156 and weighted average of 27.2%, a difference of 0.55%.
Family Households with Children Correlation Summary
| Measurement | Immigrants from Congo | African |
| Minimum | 12.8% | 3.0% |
| Maximum | 40.2% | 57.1% |
| Range | 27.4% | 54.2% |
| Mean | 27.3% | 26.8% |
| Median | 27.3% | 26.7% |
| Interquartile 25% (IQ1) | 25.2% | 23.1% |
| Interquartile 75% (IQ3) | 29.6% | 28.7% |
| Interquartile Range (IQR) | 4.4% | 5.6% |
| Standard Deviation (Sample) | 5.0% | 10.3% |
| Standard Deviation (Population) | 5.0% | 10.3% |
Demographics Similar to Immigrants from Congo and Africans by Family Households with Children
In terms of family households with children, the demographic groups most similar to Immigrants from Congo are English (27.3%, a difference of 0.090%), Bhutanese (27.3%, a difference of 0.10%), Immigrants from Romania (27.4%, a difference of 0.15%), Norwegian (27.4%, a difference of 0.16%), and American (27.3%, a difference of 0.17%). Similarly, the demographic groups most similar to Africans are Northern European (27.2%, a difference of 0.010%), Immigrants from Dominica (27.2%, a difference of 0.040%), Okinawan (27.2%, a difference of 0.040%), Cuban (27.1%, a difference of 0.040%), and U.S. Virgin Islander (27.1%, a difference of 0.040%).
| Demographics | Rating | Rank | Family Households with Children |
| Norwegians | 35.0 /100 | #197 | Fair 27.4% |
| Immigrants | Romania | 34.4 /100 | #198 | Fair 27.4% |
| English | 32.0 /100 | #199 | Fair 27.3% |
| Immigrants | Congo | 28.7 /100 | #200 | Fair 27.3% |
| Bhutanese | 25.1 /100 | #201 | Fair 27.3% |
| Americans | 22.8 /100 | #202 | Fair 27.3% |
| Kiowa | 22.2 /100 | #203 | Fair 27.3% |
| Immigrants | Sudan | 21.6 /100 | #204 | Fair 27.3% |
| Immigrants | Haiti | 20.3 /100 | #205 | Fair 27.2% |
| Immigrants | Micronesia | 20.2 /100 | #206 | Fair 27.2% |
| Haitians | 19.8 /100 | #207 | Poor 27.2% |
| Immigrants | Poland | 16.4 /100 | #208 | Poor 27.2% |
| Dutch West Indians | 15.8 /100 | #209 | Poor 27.2% |
| Immigrants | Ukraine | 14.4 /100 | #210 | Poor 27.2% |
| Welsh | 14.2 /100 | #211 | Poor 27.2% |
| Immigrants | Dominica | 13.9 /100 | #212 | Poor 27.2% |
| Okinawans | 13.7 /100 | #213 | Poor 27.2% |
| Africans | 13.0 /100 | #214 | Poor 27.2% |
| Northern Europeans | 12.8 /100 | #215 | Poor 27.2% |
| Cubans | 12.2 /100 | #216 | Poor 27.1% |
| U.S. Virgin Islanders | 12.1 /100 | #217 | Poor 27.1% |