Immigrants from Congo vs Immigrants from Romania Family Households with Children
COMPARE
Immigrants from Congo
Immigrants from Romania
Family Households with Children
Family Households with Children Comparison
Immigrants from Congo
Immigrants from Romania
27.3%
FAMILY HOUSEHOLDS WITH CHILDREN
28.7/ 100
METRIC RATING
200th/ 347
METRIC RANK
27.4%
FAMILY HOUSEHOLDS WITH CHILDREN
34.4/ 100
METRIC RATING
198th/ 347
METRIC RANK
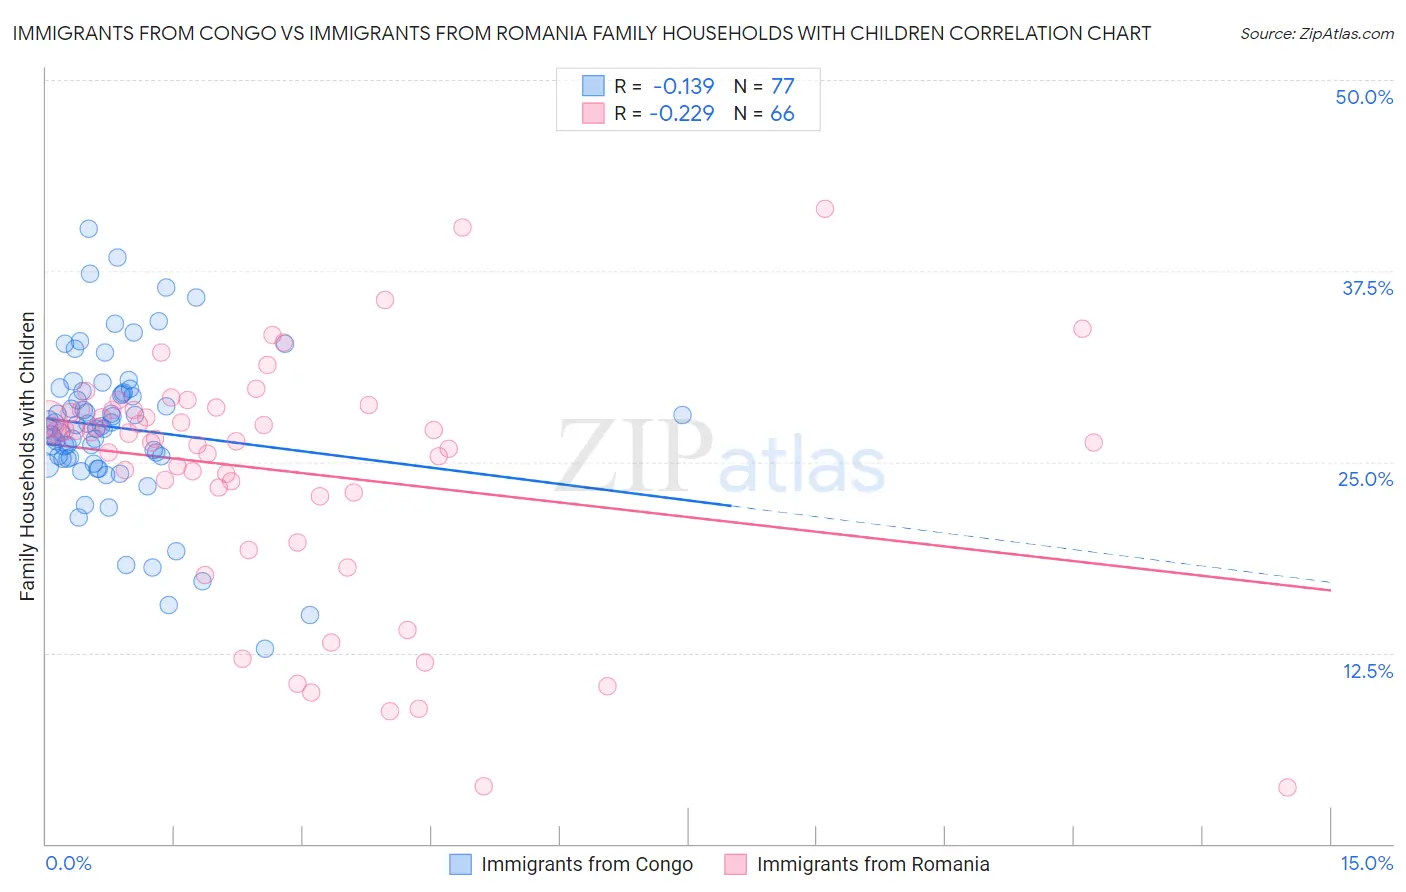
Immigrants from Congo vs Immigrants from Romania Family Households with Children Correlation Chart
The statistical analysis conducted on geographies consisting of 92,083,447 people shows a poor negative correlation between the proportion of Immigrants from Congo and percentage of family households with children in the United States with a correlation coefficient (R) of -0.139 and weighted average of 27.3%. Similarly, the statistical analysis conducted on geographies consisting of 256,873,264 people shows a weak negative correlation between the proportion of Immigrants from Romania and percentage of family households with children in the United States with a correlation coefficient (R) of -0.229 and weighted average of 27.4%, a difference of 0.15%.
Family Households with Children Correlation Summary
| Measurement | Immigrants from Congo | Immigrants from Romania |
| Minimum | 12.8% | 3.7% |
| Maximum | 40.2% | 41.5% |
| Range | 27.4% | 37.8% |
| Mean | 27.3% | 24.4% |
| Median | 27.3% | 26.7% |
| Interquartile 25% (IQ1) | 25.2% | 23.0% |
| Interquartile 75% (IQ3) | 29.6% | 28.4% |
| Interquartile Range (IQR) | 4.4% | 5.4% |
| Standard Deviation (Sample) | 5.0% | 7.9% |
| Standard Deviation (Population) | 5.0% | 7.8% |
Demographics Similar to Immigrants from Congo and Immigrants from Romania by Family Households with Children
In terms of family households with children, the demographic groups most similar to Immigrants from Congo are English (27.3%, a difference of 0.090%), Bhutanese (27.3%, a difference of 0.10%), Cheyenne (27.4%, a difference of 0.16%), Norwegian (27.4%, a difference of 0.16%), and American (27.3%, a difference of 0.17%). Similarly, the demographic groups most similar to Immigrants from Romania are Norwegian (27.4%, a difference of 0.010%), Cheyenne (27.4%, a difference of 0.020%), Crow (27.4%, a difference of 0.030%), Immigrants from Iran (27.4%, a difference of 0.040%), and Swedish (27.4%, a difference of 0.060%).
| Demographics | Rating | Rank | Family Households with Children |
| Immigrants | Israel | 37.9 /100 | #189 | Fair 27.4% |
| Immigrants | Uruguay | 37.7 /100 | #190 | Fair 27.4% |
| Sudanese | 37.6 /100 | #191 | Fair 27.4% |
| Pennsylvania Germans | 37.5 /100 | #192 | Fair 27.4% |
| Swedes | 36.9 /100 | #193 | Fair 27.4% |
| Immigrants | Iran | 36.1 /100 | #194 | Fair 27.4% |
| Crow | 35.7 /100 | #195 | Fair 27.4% |
| Cheyenne | 35.1 /100 | #196 | Fair 27.4% |
| Norwegians | 35.0 /100 | #197 | Fair 27.4% |
| Immigrants | Romania | 34.4 /100 | #198 | Fair 27.4% |
| English | 32.0 /100 | #199 | Fair 27.3% |
| Immigrants | Congo | 28.7 /100 | #200 | Fair 27.3% |
| Bhutanese | 25.1 /100 | #201 | Fair 27.3% |
| Americans | 22.8 /100 | #202 | Fair 27.3% |
| Kiowa | 22.2 /100 | #203 | Fair 27.3% |
| Immigrants | Sudan | 21.6 /100 | #204 | Fair 27.3% |
| Immigrants | Haiti | 20.3 /100 | #205 | Fair 27.2% |
| Immigrants | Micronesia | 20.2 /100 | #206 | Fair 27.2% |
| Haitians | 19.8 /100 | #207 | Poor 27.2% |
| Immigrants | Poland | 16.4 /100 | #208 | Poor 27.2% |
| Dutch West Indians | 15.8 /100 | #209 | Poor 27.2% |