Immigrants from Congo vs Hungarian Unemployment Among Women with Children Under 6 years
COMPARE
Immigrants from Congo
Hungarian
Unemployment Among Women with Children Under 6 years
Unemployment Among Women with Children Under 6 years Comparison
Immigrants from Congo
Hungarians
8.5%
UNEMPLOYMENT AMONG WOMEN WITH CHILDREN UNDER 6 YEARS
0.2/ 100
METRIC RATING
271st/ 347
METRIC RANK
7.8%
UNEMPLOYMENT AMONG WOMEN WITH CHILDREN UNDER 6 YEARS
21.2/ 100
METRIC RATING
206th/ 347
METRIC RANK
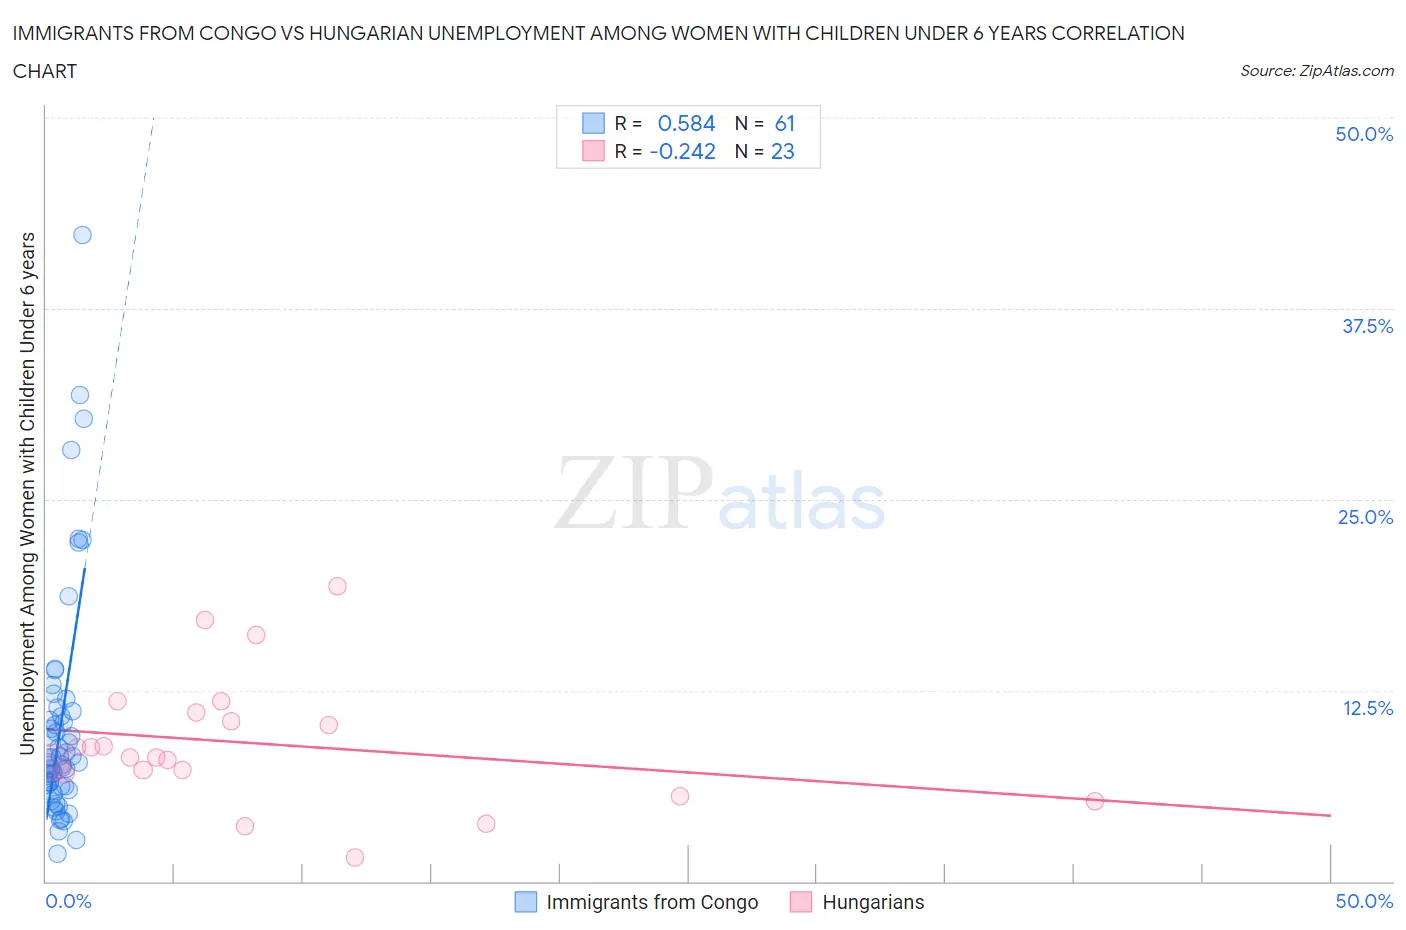
Immigrants from Congo vs Hungarian Unemployment Among Women with Children Under 6 years Correlation Chart
The statistical analysis conducted on geographies consisting of 85,861,208 people shows a substantial positive correlation between the proportion of Immigrants from Congo and unemployment rate among women with children under the age of 6 in the United States with a correlation coefficient (R) of 0.584 and weighted average of 8.5%. Similarly, the statistical analysis conducted on geographies consisting of 341,374,594 people shows a weak negative correlation between the proportion of Hungarians and unemployment rate among women with children under the age of 6 in the United States with a correlation coefficient (R) of -0.242 and weighted average of 7.8%, a difference of 8.4%.
Unemployment Among Women with Children Under 6 years Correlation Summary
| Measurement | Immigrants from Congo | Hungarian |
| Minimum | 1.8% | 1.5% |
| Maximum | 42.3% | 19.3% |
| Range | 40.5% | 17.8% |
| Mean | 10.2% | 9.0% |
| Median | 7.8% | 8.1% |
| Interquartile 25% (IQ1) | 6.2% | 7.1% |
| Interquartile 75% (IQ3) | 11.0% | 11.0% |
| Interquartile Range (IQR) | 4.8% | 3.9% |
| Standard Deviation (Sample) | 7.6% | 4.3% |
| Standard Deviation (Population) | 7.6% | 4.2% |
Similar Demographics by Unemployment Among Women with Children Under 6 years
Demographics Similar to Immigrants from Congo by Unemployment Among Women with Children Under 6 years
In terms of unemployment among women with children under 6 years, the demographic groups most similar to Immigrants from Congo are Immigrants from Senegal (8.5%, a difference of 0.010%), Immigrants from Haiti (8.4%, a difference of 0.35%), Subsaharan African (8.4%, a difference of 0.43%), Belizean (8.4%, a difference of 0.54%), and Mexican American Indian (8.5%, a difference of 0.56%).
| Demographics | Rating | Rank | Unemployment Among Women with Children Under 6 years |
| Hondurans | 0.3 /100 | #264 | Tragic 8.4% |
| French Canadians | 0.3 /100 | #265 | Tragic 8.4% |
| Immigrants | Honduras | 0.3 /100 | #266 | Tragic 8.4% |
| Belizeans | 0.2 /100 | #267 | Tragic 8.4% |
| Sub-Saharan Africans | 0.2 /100 | #268 | Tragic 8.4% |
| Immigrants | Haiti | 0.2 /100 | #269 | Tragic 8.4% |
| Immigrants | Senegal | 0.2 /100 | #270 | Tragic 8.5% |
| Immigrants | Congo | 0.2 /100 | #271 | Tragic 8.5% |
| Mexican American Indians | 0.1 /100 | #272 | Tragic 8.5% |
| Slovaks | 0.1 /100 | #273 | Tragic 8.5% |
| Immigrants | Cameroon | 0.1 /100 | #274 | Tragic 8.6% |
| Immigrants | Latin America | 0.1 /100 | #275 | Tragic 8.6% |
| Yaqui | 0.0 /100 | #276 | Tragic 8.6% |
| Haitians | 0.0 /100 | #277 | Tragic 8.6% |
| Immigrants | Dominica | 0.0 /100 | #278 | Tragic 8.6% |
Demographics Similar to Hungarians by Unemployment Among Women with Children Under 6 years
In terms of unemployment among women with children under 6 years, the demographic groups most similar to Hungarians are Immigrants (7.8%, a difference of 0.020%), Canadian (7.8%, a difference of 0.060%), Lebanese (7.8%, a difference of 0.10%), Spaniard (7.8%, a difference of 0.20%), and Sudanese (7.8%, a difference of 0.22%).
| Demographics | Rating | Rank | Unemployment Among Women with Children Under 6 years |
| Immigrants | Poland | 27.3 /100 | #199 | Fair 7.8% |
| Guamanians/Chamorros | 25.5 /100 | #200 | Fair 7.8% |
| Basques | 24.7 /100 | #201 | Fair 7.8% |
| Sudanese | 23.5 /100 | #202 | Fair 7.8% |
| Spaniards | 23.3 /100 | #203 | Fair 7.8% |
| Lebanese | 22.2 /100 | #204 | Fair 7.8% |
| Immigrants | Immigrants | 21.4 /100 | #205 | Fair 7.8% |
| Hungarians | 21.2 /100 | #206 | Fair 7.8% |
| Canadians | 20.6 /100 | #207 | Fair 7.8% |
| Immigrants | Syria | 18.9 /100 | #208 | Poor 7.8% |
| Costa Ricans | 17.6 /100 | #209 | Poor 7.8% |
| Poles | 16.0 /100 | #210 | Poor 7.9% |
| Immigrants | Ecuador | 14.9 /100 | #211 | Poor 7.9% |
| Swiss | 12.3 /100 | #212 | Poor 7.9% |
| Scottish | 11.4 /100 | #213 | Poor 7.9% |