Immigrants from Chile vs Yup'ik Family Households
COMPARE
Immigrants from Chile
Yup'ik
Family Households
Family Households Comparison
Immigrants from Chile
Yup'ik
64.6%
FAMILY HOUSEHOLDS
76.5/ 100
METRIC RATING
147th/ 347
METRIC RANK
72.4%
FAMILY HOUSEHOLDS
100/ 100
METRIC RATING
1st/ 347
METRIC RANK
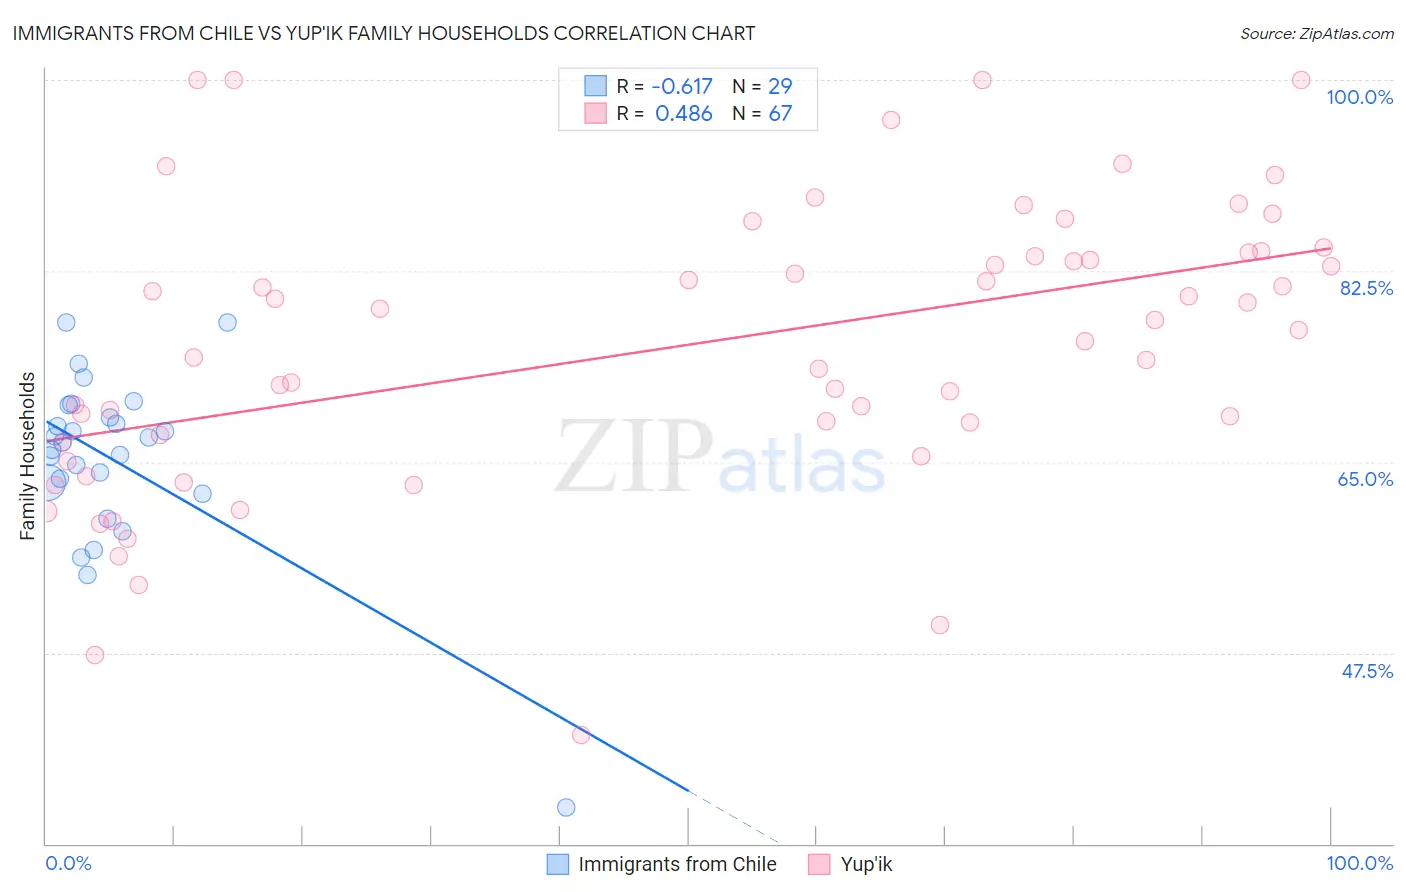
Immigrants from Chile vs Yup'ik Family Households Correlation Chart
The statistical analysis conducted on geographies consisting of 218,601,267 people shows a significant negative correlation between the proportion of Immigrants from Chile and percentage of family households in the United States with a correlation coefficient (R) of -0.617 and weighted average of 64.6%. Similarly, the statistical analysis conducted on geographies consisting of 39,956,676 people shows a moderate positive correlation between the proportion of Yup'ik and percentage of family households in the United States with a correlation coefficient (R) of 0.486 and weighted average of 72.4%, a difference of 12.2%.
Family Households Correlation Summary
| Measurement | Immigrants from Chile | Yup'ik |
| Minimum | 33.3% | 40.0% |
| Maximum | 77.8% | 100.0% |
| Range | 44.5% | 60.0% |
| Mean | 65.2% | 75.6% |
| Median | 66.8% | 77.1% |
| Interquartile 25% (IQ1) | 62.6% | 66.8% |
| Interquartile 75% (IQ3) | 69.7% | 84.2% |
| Interquartile Range (IQR) | 7.0% | 17.4% |
| Standard Deviation (Sample) | 8.4% | 13.2% |
| Standard Deviation (Population) | 8.2% | 13.1% |
Similar Demographics by Family Households
Demographics Similar to Immigrants from Chile by Family Households
In terms of family households, the demographic groups most similar to Immigrants from Chile are Delaware (64.6%, a difference of 0.0%), Sioux (64.6%, a difference of 0.0%), Immigrants from Romania (64.6%, a difference of 0.010%), Romanian (64.5%, a difference of 0.020%), and Syrian (64.5%, a difference of 0.020%).
| Demographics | Rating | Rank | Family Households |
| Immigrants | North Macedonia | 84.9 /100 | #140 | Excellent 64.7% |
| Immigrants | Cameroon | 84.8 /100 | #141 | Excellent 64.7% |
| Pakistanis | 84.0 /100 | #142 | Excellent 64.7% |
| Czechoslovakians | 82.1 /100 | #143 | Excellent 64.6% |
| South American Indians | 81.9 /100 | #144 | Excellent 64.6% |
| Welsh | 80.1 /100 | #145 | Excellent 64.6% |
| Immigrants | Romania | 77.0 /100 | #146 | Good 64.6% |
| Immigrants | Chile | 76.5 /100 | #147 | Good 64.6% |
| Delaware | 76.3 /100 | #148 | Good 64.6% |
| Sioux | 76.3 /100 | #149 | Good 64.6% |
| Romanians | 75.3 /100 | #150 | Good 64.5% |
| Syrians | 75.2 /100 | #151 | Good 64.5% |
| Scottish | 70.9 /100 | #152 | Good 64.5% |
| Swedes | 69.8 /100 | #153 | Good 64.5% |
| Austrians | 68.5 /100 | #154 | Good 64.5% |
Demographics Similar to Yup'ik by Family Households
In terms of family households, the demographic groups most similar to Yup'ik are Spanish American Indian (71.2%, a difference of 1.8%), Tongan (69.6%, a difference of 4.0%), Yakama (69.3%, a difference of 4.5%), Yuman (69.3%, a difference of 4.5%), and Immigrants from Mexico (69.1%, a difference of 4.8%).
| Demographics | Rating | Rank | Family Households |
| Yup'ik | 100 /100 | #1 | Exceptional 72.4% |
| Spanish American Indians | 100.0 /100 | #2 | Exceptional 71.2% |
| Tongans | 100.0 /100 | #3 | Exceptional 69.6% |
| Yakama | 100.0 /100 | #4 | Exceptional 69.3% |
| Yuman | 100.0 /100 | #5 | Exceptional 69.3% |
| Immigrants | Mexico | 100.0 /100 | #6 | Exceptional 69.1% |
| Mexicans | 100.0 /100 | #7 | Exceptional 69.0% |
| Immigrants | Fiji | 100.0 /100 | #8 | Exceptional 68.8% |
| Native Hawaiians | 100.0 /100 | #9 | Exceptional 68.4% |
| Immigrants | Philippines | 100.0 /100 | #10 | Exceptional 68.3% |
| Immigrants | Central America | 100.0 /100 | #11 | Exceptional 68.3% |
| Koreans | 100.0 /100 | #12 | Exceptional 68.3% |
| Pueblo | 100.0 /100 | #13 | Exceptional 68.2% |
| Immigrants | Cuba | 100.0 /100 | #14 | Exceptional 68.2% |
| Assyrians/Chaldeans/Syriacs | 100.0 /100 | #15 | Exceptional 68.2% |