Immigrants from Caribbean vs Palestinian 2nd Grade
COMPARE
Immigrants from Caribbean
Palestinian
2nd Grade
2nd Grade Comparison
Immigrants from Caribbean
Palestinians
96.9%
2ND GRADE
0.0/ 100
METRIC RATING
304th/ 347
METRIC RANK
98.0%
2ND GRADE
83.9/ 100
METRIC RATING
140th/ 347
METRIC RANK
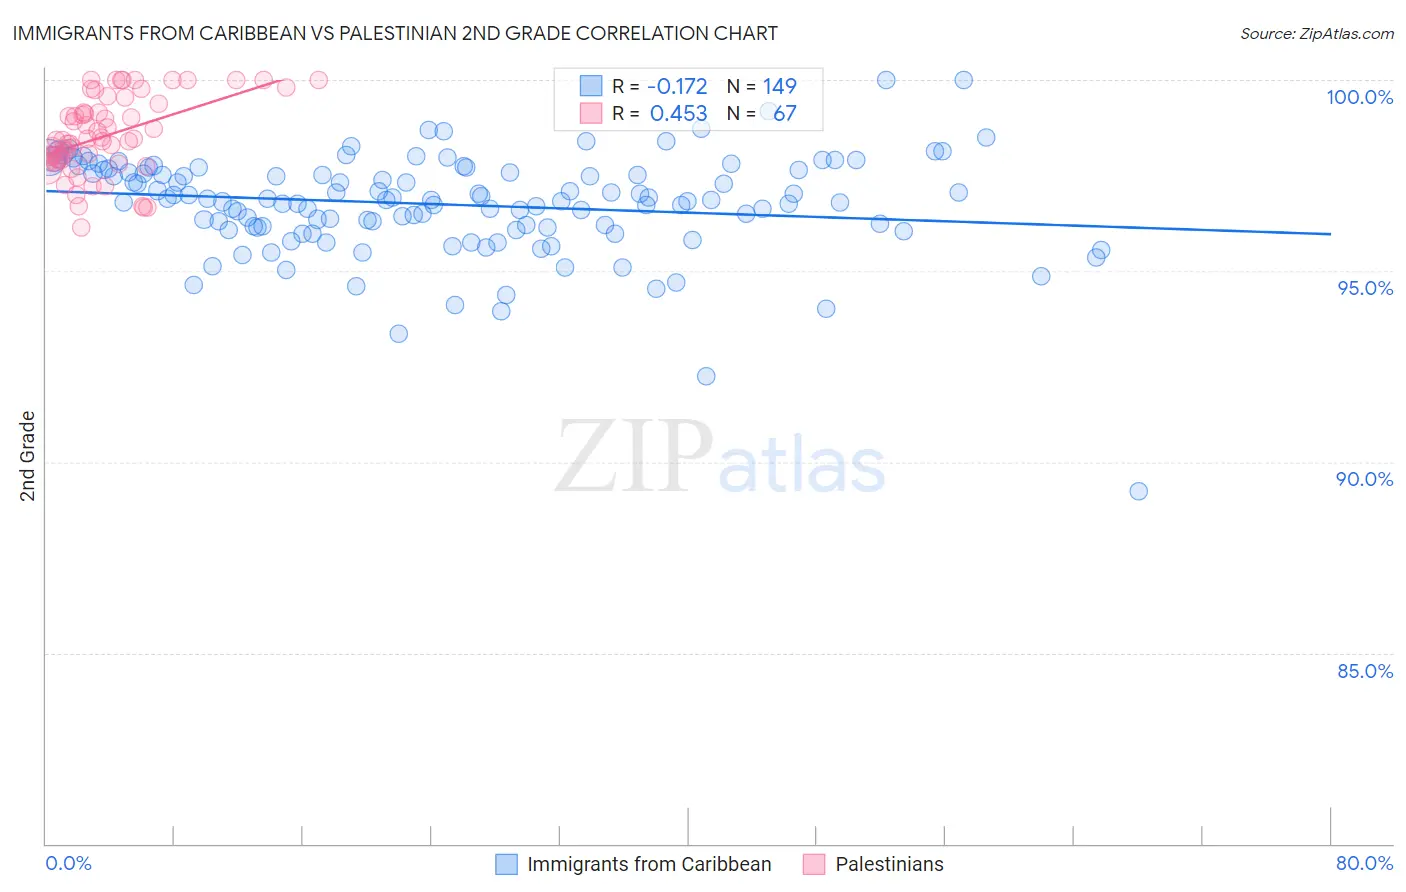
Immigrants from Caribbean vs Palestinian 2nd Grade Correlation Chart
The statistical analysis conducted on geographies consisting of 450,065,262 people shows a poor negative correlation between the proportion of Immigrants from Caribbean and percentage of population with at least 2nd grade education in the United States with a correlation coefficient (R) of -0.172 and weighted average of 96.9%. Similarly, the statistical analysis conducted on geographies consisting of 216,457,008 people shows a moderate positive correlation between the proportion of Palestinians and percentage of population with at least 2nd grade education in the United States with a correlation coefficient (R) of 0.453 and weighted average of 98.0%, a difference of 1.1%.
2nd Grade Correlation Summary
| Measurement | Immigrants from Caribbean | Palestinian |
| Minimum | 89.2% | 96.1% |
| Maximum | 100.0% | 100.0% |
| Range | 10.8% | 3.9% |
| Mean | 96.7% | 98.5% |
| Median | 96.8% | 98.4% |
| Interquartile 25% (IQ1) | 96.1% | 97.9% |
| Interquartile 75% (IQ3) | 97.6% | 99.4% |
| Interquartile Range (IQR) | 1.5% | 1.4% |
| Standard Deviation (Sample) | 1.4% | 1.0% |
| Standard Deviation (Population) | 1.3% | 1.0% |
Similar Demographics by 2nd Grade
Demographics Similar to Immigrants from Caribbean by 2nd Grade
In terms of 2nd grade, the demographic groups most similar to Immigrants from Caribbean are Ecuadorian (96.9%, a difference of 0.0%), Nicaraguan (96.9%, a difference of 0.020%), Immigrants from Somalia (96.9%, a difference of 0.040%), Somali (97.0%, a difference of 0.050%), and Central American Indian (97.0%, a difference of 0.070%).
| Demographics | Rating | Rank | 2nd Grade |
| Immigrants | Cuba | 0.0 /100 | #297 | Tragic 97.0% |
| Immigrants | Dominica | 0.0 /100 | #298 | Tragic 97.0% |
| Haitians | 0.0 /100 | #299 | Tragic 97.0% |
| Immigrants | South Eastern Asia | 0.0 /100 | #300 | Tragic 97.0% |
| Central American Indians | 0.0 /100 | #301 | Tragic 97.0% |
| Somalis | 0.0 /100 | #302 | Tragic 97.0% |
| Ecuadorians | 0.0 /100 | #303 | Tragic 96.9% |
| Immigrants | Caribbean | 0.0 /100 | #304 | Tragic 96.9% |
| Nicaraguans | 0.0 /100 | #305 | Tragic 96.9% |
| Immigrants | Somalia | 0.0 /100 | #306 | Tragic 96.9% |
| Immigrants | Azores | 0.0 /100 | #307 | Tragic 96.8% |
| Immigrants | Haiti | 0.0 /100 | #308 | Tragic 96.8% |
| Belizeans | 0.0 /100 | #309 | Tragic 96.8% |
| Sri Lankans | 0.0 /100 | #310 | Tragic 96.8% |
| Guyanese | 0.0 /100 | #311 | Tragic 96.8% |
Demographics Similar to Palestinians by 2nd Grade
In terms of 2nd grade, the demographic groups most similar to Palestinians are Immigrants from Turkey (98.0%, a difference of 0.010%), Blackfeet (98.0%, a difference of 0.020%), Burmese (98.0%, a difference of 0.020%), Alsatian (98.0%, a difference of 0.020%), and Hmong (98.0%, a difference of 0.020%).
| Demographics | Rating | Rank | 2nd Grade |
| Cambodians | 90.7 /100 | #133 | Exceptional 98.0% |
| Immigrants | Hungary | 89.7 /100 | #134 | Excellent 98.0% |
| Immigrants | Bulgaria | 89.7 /100 | #135 | Excellent 98.0% |
| Immigrants | Kuwait | 89.2 /100 | #136 | Excellent 98.0% |
| Immigrants | Romania | 88.3 /100 | #137 | Excellent 98.0% |
| Israelis | 87.9 /100 | #138 | Excellent 98.0% |
| Blackfeet | 87.5 /100 | #139 | Excellent 98.0% |
| Palestinians | 83.9 /100 | #140 | Excellent 98.0% |
| Immigrants | Turkey | 83.0 /100 | #141 | Excellent 98.0% |
| Burmese | 81.0 /100 | #142 | Excellent 98.0% |
| Alsatians | 80.5 /100 | #143 | Excellent 98.0% |
| Hmong | 80.0 /100 | #144 | Good 98.0% |
| Filipinos | 79.2 /100 | #145 | Good 98.0% |
| Immigrants | Israel | 78.0 /100 | #146 | Good 98.0% |
| Immigrants | Greece | 76.8 /100 | #147 | Good 98.0% |