Immigrants from Cameroon vs Yugoslavian Divorced or Separated
COMPARE
Immigrants from Cameroon
Yugoslavian
Divorced or Separated
Divorced or Separated Comparison
Immigrants from Cameroon
Yugoslavians
12.3%
DIVORCED OR SEPARATED
8.3/ 100
METRIC RATING
228th/ 347
METRIC RANK
12.3%
DIVORCED OR SEPARATED
6.6/ 100
METRIC RATING
231st/ 347
METRIC RANK
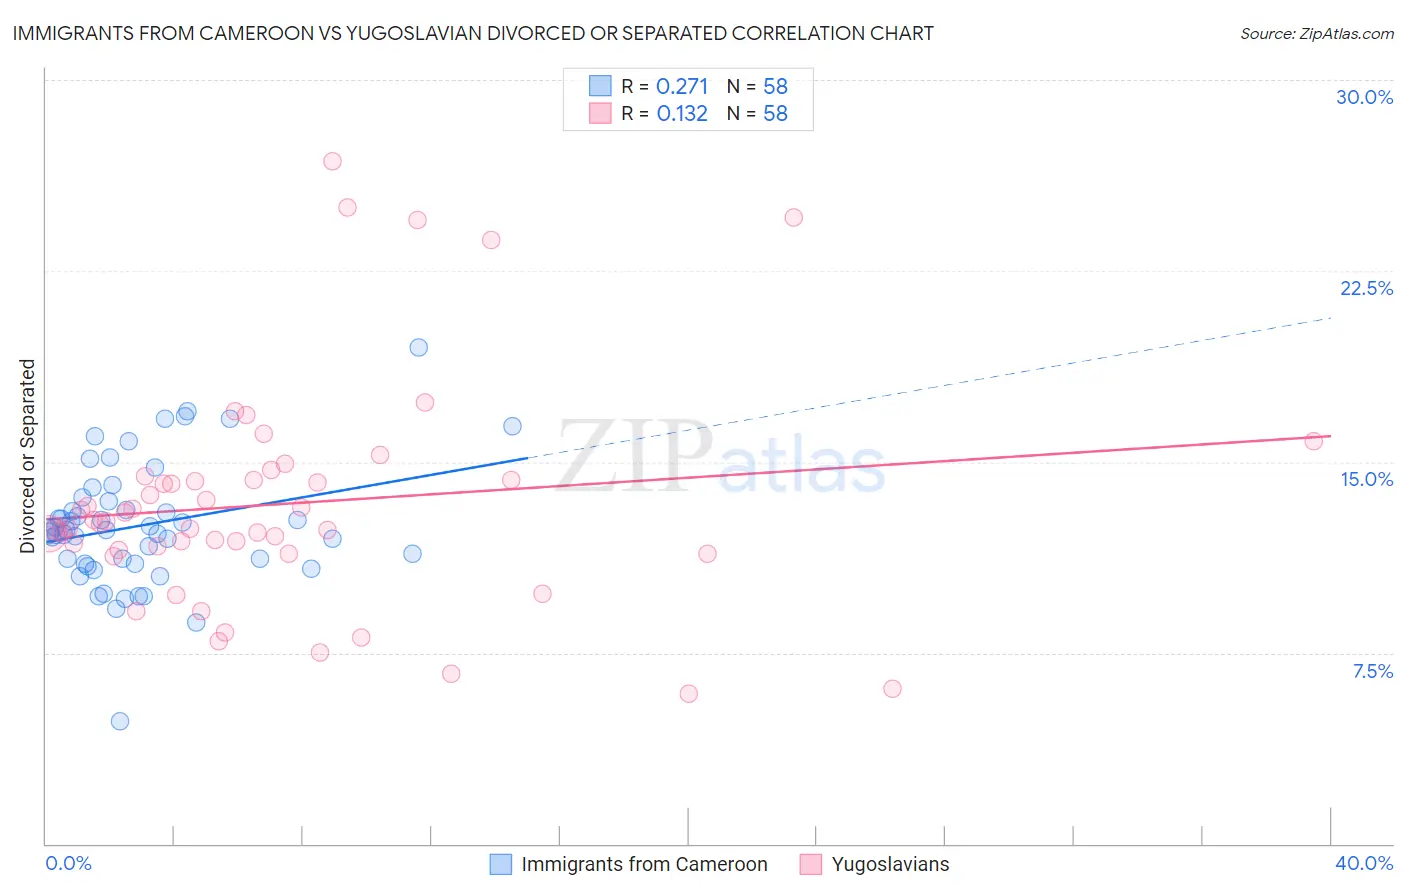
Immigrants from Cameroon vs Yugoslavian Divorced or Separated Correlation Chart
The statistical analysis conducted on geographies consisting of 130,744,662 people shows a weak positive correlation between the proportion of Immigrants from Cameroon and percentage of population currently divorced or separated in the United States with a correlation coefficient (R) of 0.271 and weighted average of 12.3%. Similarly, the statistical analysis conducted on geographies consisting of 285,666,571 people shows a poor positive correlation between the proportion of Yugoslavians and percentage of population currently divorced or separated in the United States with a correlation coefficient (R) of 0.132 and weighted average of 12.3%, a difference of 0.22%.
Divorced or Separated Correlation Summary
| Measurement | Immigrants from Cameroon | Yugoslavian |
| Minimum | 4.8% | 5.9% |
| Maximum | 19.5% | 26.8% |
| Range | 14.7% | 20.9% |
| Mean | 12.5% | 13.4% |
| Median | 12.3% | 12.6% |
| Interquartile 25% (IQ1) | 11.0% | 11.5% |
| Interquartile 75% (IQ3) | 13.5% | 14.3% |
| Interquartile Range (IQR) | 2.5% | 2.8% |
| Standard Deviation (Sample) | 2.4% | 4.4% |
| Standard Deviation (Population) | 2.4% | 4.4% |
Demographics Similar to Immigrants from Cameroon and Yugoslavians by Divorced or Separated
In terms of divorced or separated, the demographic groups most similar to Immigrants from Cameroon are Immigrants from Sudan (12.3%, a difference of 0.020%), Hmong (12.3%, a difference of 0.050%), Yakama (12.3%, a difference of 0.060%), Immigrants from Western Africa (12.3%, a difference of 0.10%), and Immigrants from the Azores (12.3%, a difference of 0.14%). Similarly, the demographic groups most similar to Yugoslavians are Yakama (12.3%, a difference of 0.15%), Canadian (12.4%, a difference of 0.19%), Immigrants from Sudan (12.3%, a difference of 0.20%), Hmong (12.3%, a difference of 0.27%), and Malaysian (12.4%, a difference of 0.28%).
| Demographics | Rating | Rank | Divorced or Separated |
| Czechoslovakians | 11.7 /100 | #219 | Poor 12.3% |
| British | 11.6 /100 | #220 | Poor 12.3% |
| Guamanians/Chamorros | 11.3 /100 | #221 | Poor 12.3% |
| Bangladeshis | 10.5 /100 | #222 | Poor 12.3% |
| Scandinavians | 10.4 /100 | #223 | Poor 12.3% |
| Immigrants | Azores | 9.7 /100 | #224 | Tragic 12.3% |
| Belgians | 9.7 /100 | #225 | Tragic 12.3% |
| Immigrants | Western Africa | 9.3 /100 | #226 | Tragic 12.3% |
| Hmong | 8.8 /100 | #227 | Tragic 12.3% |
| Immigrants | Cameroon | 8.3 /100 | #228 | Tragic 12.3% |
| Immigrants | Sudan | 8.2 /100 | #229 | Tragic 12.3% |
| Yakama | 7.8 /100 | #230 | Tragic 12.3% |
| Yugoslavians | 6.6 /100 | #231 | Tragic 12.3% |
| Canadians | 5.3 /100 | #232 | Tragic 12.4% |
| Malaysians | 4.8 /100 | #233 | Tragic 12.4% |
| West Indians | 4.4 /100 | #234 | Tragic 12.4% |
| Immigrants | Bosnia and Herzegovina | 4.3 /100 | #235 | Tragic 12.4% |
| Colombians | 4.2 /100 | #236 | Tragic 12.4% |
| Immigrants | Laos | 4.2 /100 | #237 | Tragic 12.4% |
| Sudanese | 4.0 /100 | #238 | Tragic 12.4% |
| Immigrants | Germany | 4.0 /100 | #239 | Tragic 12.4% |