Immigrants from Cameroon vs Bangladeshi Births to Unmarried Women
COMPARE
Immigrants from Cameroon
Bangladeshi
Births to Unmarried Women
Births to Unmarried Women Comparison
Immigrants from Cameroon
Bangladeshis
34.7%
BIRTHS TO UNMARRIED WOMEN
1.6/ 100
METRIC RATING
236th/ 347
METRIC RANK
34.4%
BIRTHS TO UNMARRIED WOMEN
2.5/ 100
METRIC RATING
233rd/ 347
METRIC RANK
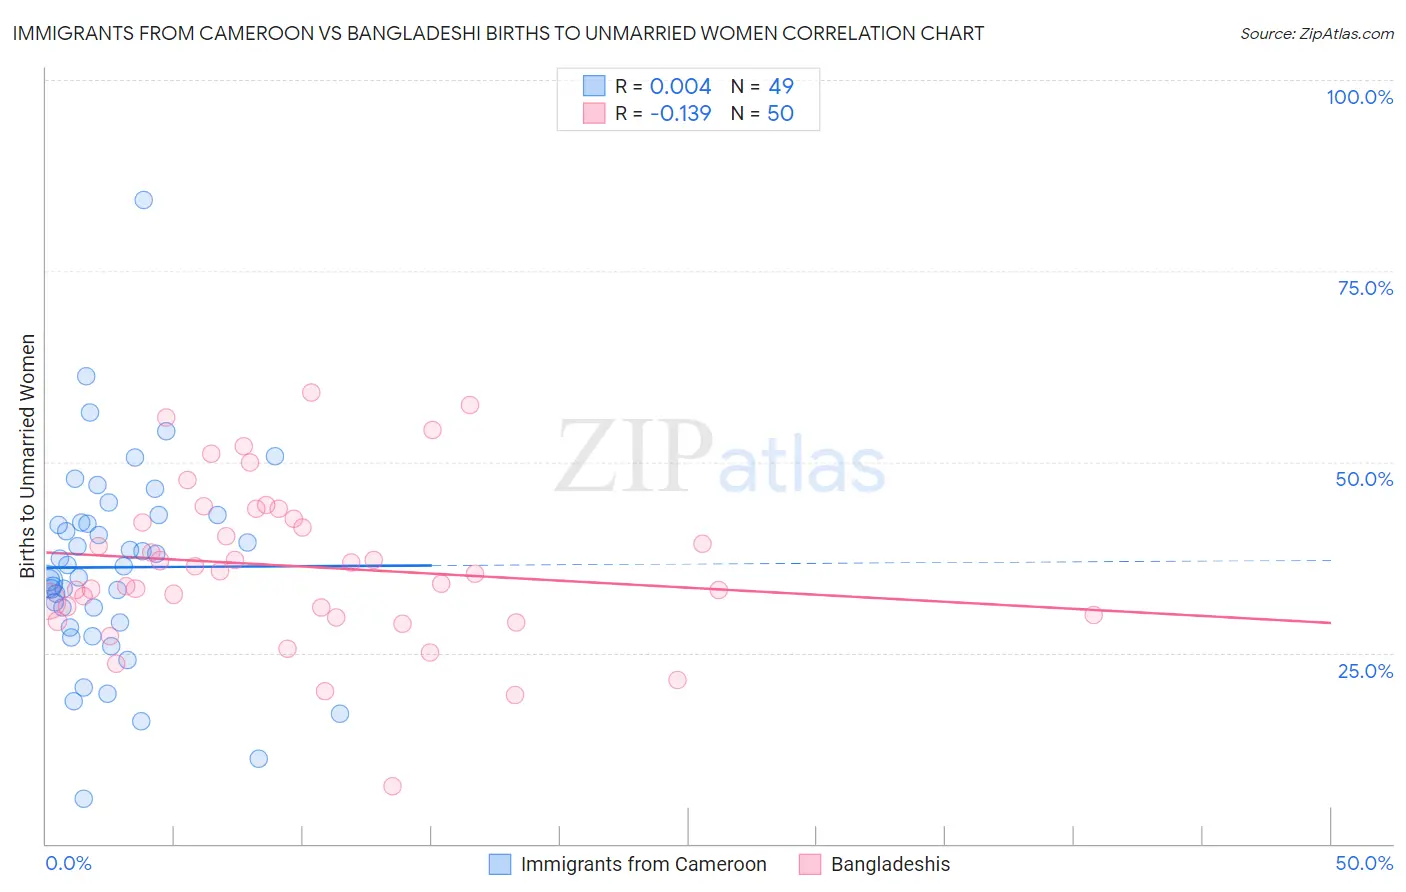
Immigrants from Cameroon vs Bangladeshi Births to Unmarried Women Correlation Chart
The statistical analysis conducted on geographies consisting of 128,569,403 people shows no correlation between the proportion of Immigrants from Cameroon and percentage of births to unmarried women in the United States with a correlation coefficient (R) of 0.004 and weighted average of 34.7%. Similarly, the statistical analysis conducted on geographies consisting of 137,729,923 people shows a poor negative correlation between the proportion of Bangladeshis and percentage of births to unmarried women in the United States with a correlation coefficient (R) of -0.139 and weighted average of 34.4%, a difference of 0.94%.
Births to Unmarried Women Correlation Summary
| Measurement | Immigrants from Cameroon | Bangladeshi |
| Minimum | 5.9% | 7.6% |
| Maximum | 84.3% | 59.1% |
| Range | 78.4% | 51.5% |
| Mean | 36.2% | 36.4% |
| Median | 36.4% | 35.5% |
| Interquartile 25% (IQ1) | 28.6% | 30.0% |
| Interquartile 75% (IQ3) | 42.5% | 42.6% |
| Interquartile Range (IQR) | 13.9% | 12.6% |
| Standard Deviation (Sample) | 13.4% | 10.4% |
| Standard Deviation (Population) | 13.2% | 10.3% |
Demographics Similar to Immigrants from Cameroon and Bangladeshis by Births to Unmarried Women
In terms of births to unmarried women, the demographic groups most similar to Immigrants from Cameroon are Marshallese (34.8%, a difference of 0.070%), Immigrants from Cambodia (34.8%, a difference of 0.13%), Sierra Leonean (34.9%, a difference of 0.36%), Immigrants from Middle Africa (34.9%, a difference of 0.61%), and Immigrants from Ghana (34.5%, a difference of 0.63%). Similarly, the demographic groups most similar to Bangladeshis are French Canadian (34.4%, a difference of 0.020%), Immigrants from Zaire (34.5%, a difference of 0.24%), Native Hawaiian (34.3%, a difference of 0.31%), Immigrants from Ghana (34.5%, a difference of 0.31%), and Ghanaian (34.3%, a difference of 0.46%).
| Demographics | Rating | Rank | Births to Unmarried Women |
| Immigrants | Laos | 4.3 /100 | #224 | Tragic 34.0% |
| Spanish | 4.0 /100 | #225 | Tragic 34.1% |
| Delaware | 3.3 /100 | #226 | Tragic 34.2% |
| Immigrants | Panama | 3.3 /100 | #227 | Tragic 34.2% |
| Panamanians | 3.3 /100 | #228 | Tragic 34.2% |
| Immigrants | Sierra Leone | 3.1 /100 | #229 | Tragic 34.2% |
| Ghanaians | 3.1 /100 | #230 | Tragic 34.3% |
| Native Hawaiians | 2.9 /100 | #231 | Tragic 34.3% |
| French Canadians | 2.5 /100 | #232 | Tragic 34.4% |
| Bangladeshis | 2.5 /100 | #233 | Tragic 34.4% |
| Immigrants | Zaire | 2.3 /100 | #234 | Tragic 34.5% |
| Immigrants | Ghana | 2.2 /100 | #235 | Tragic 34.5% |
| Immigrants | Cameroon | 1.6 /100 | #236 | Tragic 34.7% |
| Marshallese | 1.6 /100 | #237 | Tragic 34.8% |
| Immigrants | Cambodia | 1.6 /100 | #238 | Tragic 34.8% |
| Sierra Leoneans | 1.4 /100 | #239 | Tragic 34.9% |
| Immigrants | Middle Africa | 1.2 /100 | #240 | Tragic 34.9% |
| Immigrants | Guyana | 1.2 /100 | #241 | Tragic 35.0% |
| Indonesians | 1.2 /100 | #242 | Tragic 35.0% |
| Japanese | 0.9 /100 | #243 | Tragic 35.2% |
| Guyanese | 0.9 /100 | #244 | Tragic 35.2% |