Immigrants from Cameroon vs Apache Hearing Disability
COMPARE
Immigrants from Cameroon
Apache
Hearing Disability
Hearing Disability Comparison
Immigrants from Cameroon
Apache
2.6%
HEARING DISABILITY
99.7/ 100
METRIC RATING
31st/ 347
METRIC RANK
4.1%
HEARING DISABILITY
0.0/ 100
METRIC RATING
323rd/ 347
METRIC RANK
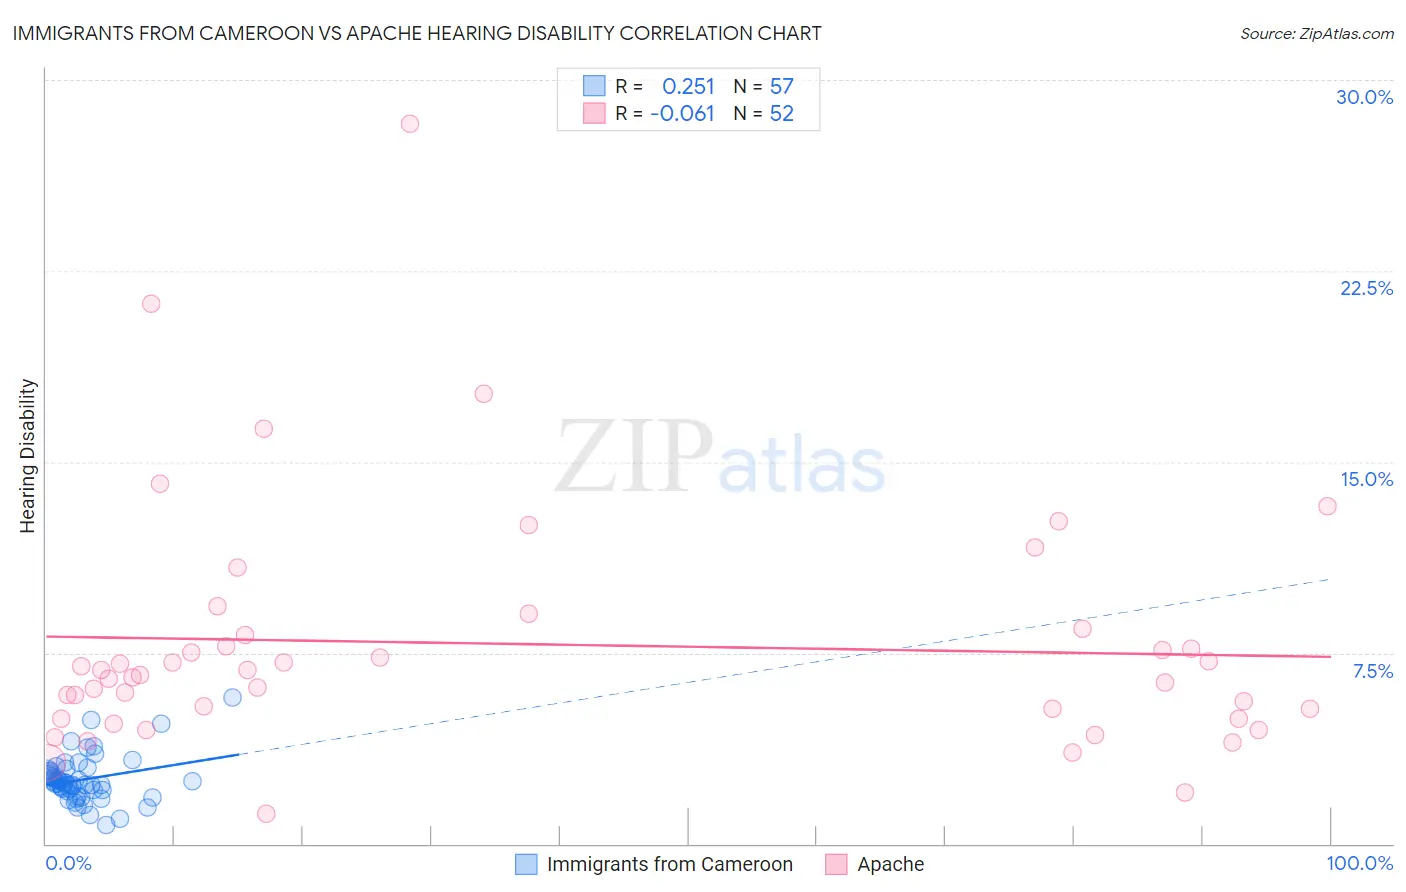
Immigrants from Cameroon vs Apache Hearing Disability Correlation Chart
The statistical analysis conducted on geographies consisting of 130,730,708 people shows a weak positive correlation between the proportion of Immigrants from Cameroon and percentage of population with hearing disability in the United States with a correlation coefficient (R) of 0.251 and weighted average of 2.6%. Similarly, the statistical analysis conducted on geographies consisting of 231,022,751 people shows a slight negative correlation between the proportion of Apache and percentage of population with hearing disability in the United States with a correlation coefficient (R) of -0.061 and weighted average of 4.1%, a difference of 57.7%.
Hearing Disability Correlation Summary
| Measurement | Immigrants from Cameroon | Apache |
| Minimum | 0.75% | 1.2% |
| Maximum | 5.7% | 28.3% |
| Range | 5.0% | 27.1% |
| Mean | 2.5% | 7.8% |
| Median | 2.4% | 6.7% |
| Interquartile 25% (IQ1) | 2.1% | 5.1% |
| Interquartile 75% (IQ3) | 2.8% | 8.3% |
| Interquartile Range (IQR) | 0.75% | 3.2% |
| Standard Deviation (Sample) | 0.91% | 4.8% |
| Standard Deviation (Population) | 0.90% | 4.8% |
Similar Demographics by Hearing Disability
Demographics Similar to Immigrants from Cameroon by Hearing Disability
In terms of hearing disability, the demographic groups most similar to Immigrants from Cameroon are Immigrants from Caribbean (2.6%, a difference of 0.010%), Bolivian (2.6%, a difference of 0.090%), Immigrants from Haiti (2.6%, a difference of 0.11%), Immigrants from Venezuela (2.6%, a difference of 0.14%), and Filipino (2.6%, a difference of 0.40%).
| Demographics | Rating | Rank | Hearing Disability |
| Immigrants | Ghana | 99.8 /100 | #24 | Exceptional 2.6% |
| Immigrants | El Salvador | 99.7 /100 | #25 | Exceptional 2.6% |
| Immigrants | Senegal | 99.7 /100 | #26 | Exceptional 2.6% |
| Immigrants | South Central Asia | 99.7 /100 | #27 | Exceptional 2.6% |
| Immigrants | Haiti | 99.7 /100 | #28 | Exceptional 2.6% |
| Bolivians | 99.7 /100 | #29 | Exceptional 2.6% |
| Immigrants | Caribbean | 99.7 /100 | #30 | Exceptional 2.6% |
| Immigrants | Cameroon | 99.7 /100 | #31 | Exceptional 2.6% |
| Immigrants | Venezuela | 99.7 /100 | #32 | Exceptional 2.6% |
| Filipinos | 99.6 /100 | #33 | Exceptional 2.6% |
| Immigrants | Pakistan | 99.6 /100 | #34 | Exceptional 2.6% |
| Salvadorans | 99.6 /100 | #35 | Exceptional 2.6% |
| Okinawans | 99.6 /100 | #36 | Exceptional 2.6% |
| Immigrants | Western Africa | 99.6 /100 | #37 | Exceptional 2.6% |
| Immigrants | Jamaica | 99.5 /100 | #38 | Exceptional 2.6% |
Demographics Similar to Apache by Hearing Disability
In terms of hearing disability, the demographic groups most similar to Apache are Osage (4.1%, a difference of 0.070%), Seminole (4.1%, a difference of 0.12%), Paiute (4.1%, a difference of 0.38%), Lumbee (4.1%, a difference of 0.39%), and Potawatomi (4.1%, a difference of 0.68%).
| Demographics | Rating | Rank | Hearing Disability |
| Spanish Americans | 0.0 /100 | #316 | Tragic 4.0% |
| Comanche | 0.0 /100 | #317 | Tragic 4.0% |
| Cheyenne | 0.0 /100 | #318 | Tragic 4.0% |
| Chippewa | 0.0 /100 | #319 | Tragic 4.0% |
| Shoshone | 0.0 /100 | #320 | Tragic 4.0% |
| Paiute | 0.0 /100 | #321 | Tragic 4.1% |
| Seminole | 0.0 /100 | #322 | Tragic 4.1% |
| Apache | 0.0 /100 | #323 | Tragic 4.1% |
| Osage | 0.0 /100 | #324 | Tragic 4.1% |
| Lumbee | 0.0 /100 | #325 | Tragic 4.1% |
| Potawatomi | 0.0 /100 | #326 | Tragic 4.1% |
| Arapaho | 0.0 /100 | #327 | Tragic 4.1% |
| Tohono O'odham | 0.0 /100 | #328 | Tragic 4.2% |
| Crow | 0.0 /100 | #329 | Tragic 4.2% |
| Natives/Alaskans | 0.0 /100 | #330 | Tragic 4.2% |