Immigrants from Cameroon vs Apache 7th Grade
COMPARE
Immigrants from Cameroon
Apache
7th Grade
7th Grade Comparison
Immigrants from Cameroon
Apache
95.4%
7TH GRADE
0.9/ 100
METRIC RATING
250th/ 347
METRIC RANK
95.9%
7TH GRADE
27.6/ 100
METRIC RATING
196th/ 347
METRIC RANK
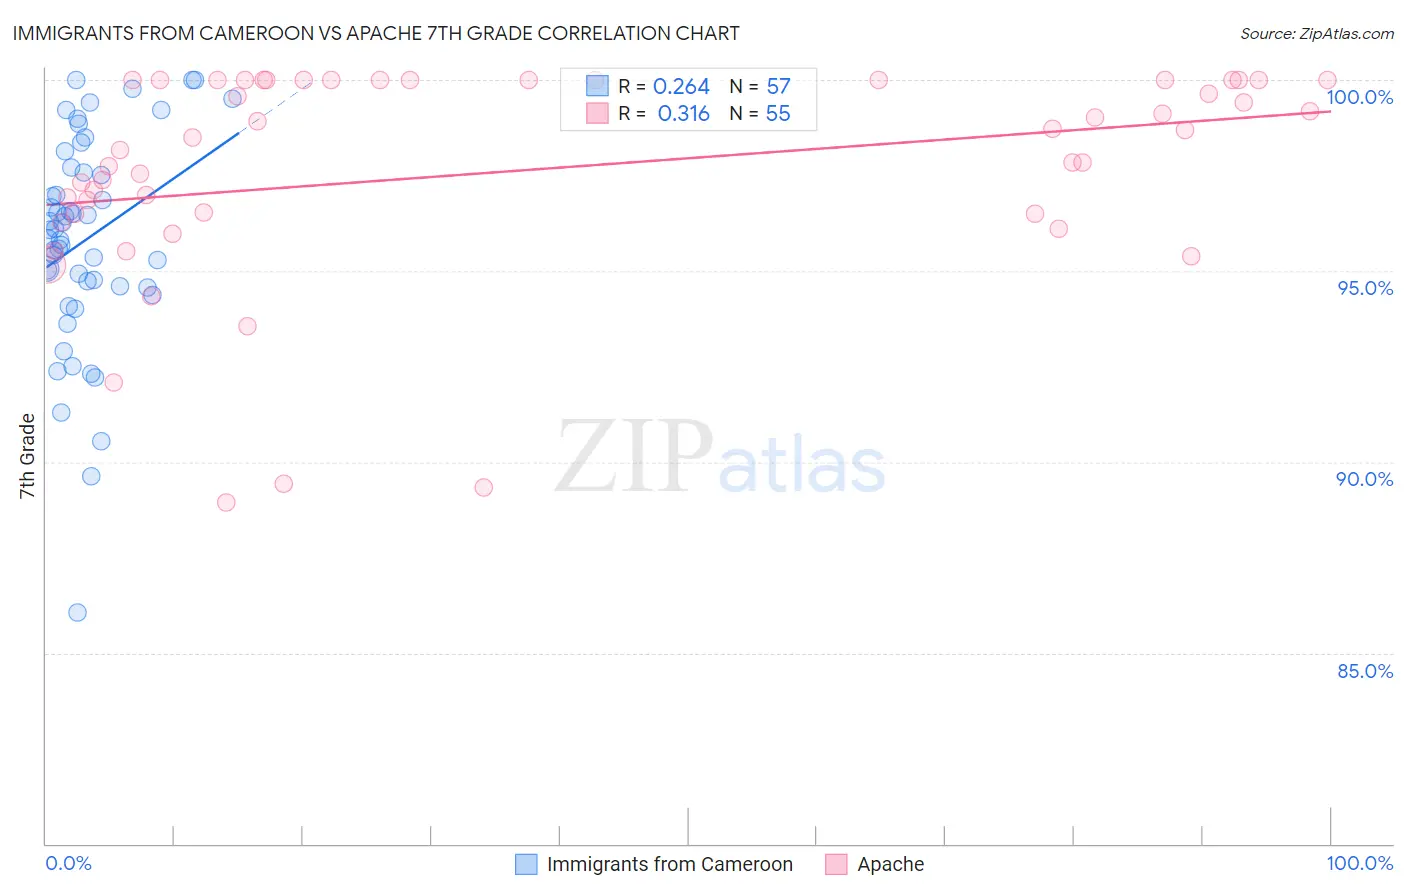
Immigrants from Cameroon vs Apache 7th Grade Correlation Chart
The statistical analysis conducted on geographies consisting of 130,618,704 people shows a weak positive correlation between the proportion of Immigrants from Cameroon and percentage of population with at least 7th grade education in the United States with a correlation coefficient (R) of 0.264 and weighted average of 95.4%. Similarly, the statistical analysis conducted on geographies consisting of 231,142,961 people shows a mild positive correlation between the proportion of Apache and percentage of population with at least 7th grade education in the United States with a correlation coefficient (R) of 0.316 and weighted average of 95.9%, a difference of 0.57%.
7th Grade Correlation Summary
| Measurement | Immigrants from Cameroon | Apache |
| Minimum | 86.1% | 88.9% |
| Maximum | 100.0% | 100.0% |
| Range | 13.9% | 11.1% |
| Mean | 95.8% | 97.6% |
| Median | 96.1% | 98.5% |
| Interquartile 25% (IQ1) | 94.6% | 96.5% |
| Interquartile 75% (IQ3) | 97.6% | 100.0% |
| Interquartile Range (IQR) | 3.1% | 3.5% |
| Standard Deviation (Sample) | 2.8% | 2.8% |
| Standard Deviation (Population) | 2.8% | 2.8% |
Similar Demographics by 7th Grade
Demographics Similar to Immigrants from Cameroon by 7th Grade
In terms of 7th grade, the demographic groups most similar to Immigrants from Cameroon are Immigrants from Jamaica (95.4%, a difference of 0.0%), Immigrants from Ethiopia (95.3%, a difference of 0.0%), Somali (95.3%, a difference of 0.010%), Bolivian (95.4%, a difference of 0.020%), and Colombian (95.3%, a difference of 0.020%).
| Demographics | Rating | Rank | 7th Grade |
| U.S. Virgin Islanders | 1.6 /100 | #243 | Tragic 95.4% |
| Uruguayans | 1.6 /100 | #244 | Tragic 95.4% |
| Immigrants | Middle Africa | 1.5 /100 | #245 | Tragic 95.4% |
| Ethiopians | 1.5 /100 | #246 | Tragic 95.4% |
| Tongans | 1.3 /100 | #247 | Tragic 95.4% |
| Paiute | 1.2 /100 | #248 | Tragic 95.4% |
| Bolivians | 1.1 /100 | #249 | Tragic 95.4% |
| Immigrants | Cameroon | 0.9 /100 | #250 | Tragic 95.4% |
| Immigrants | Jamaica | 0.9 /100 | #251 | Tragic 95.4% |
| Immigrants | Ethiopia | 0.9 /100 | #252 | Tragic 95.3% |
| Somalis | 0.9 /100 | #253 | Tragic 95.3% |
| Colombians | 0.8 /100 | #254 | Tragic 95.3% |
| Koreans | 0.8 /100 | #255 | Tragic 95.3% |
| Immigrants | China | 0.7 /100 | #256 | Tragic 95.3% |
| Immigrants | Congo | 0.7 /100 | #257 | Tragic 95.3% |
Demographics Similar to Apache by 7th Grade
In terms of 7th grade, the demographic groups most similar to Apache are Sudanese (95.9%, a difference of 0.0%), Immigrants from Zaire (95.9%, a difference of 0.010%), Immigrants from Bahamas (95.9%, a difference of 0.020%), Immigrants from Nepal (95.9%, a difference of 0.020%), and Paraguayan (95.9%, a difference of 0.020%).
| Demographics | Rating | Rank | 7th Grade |
| Immigrants | Venezuela | 33.9 /100 | #189 | Fair 95.9% |
| Immigrants | Micronesia | 32.6 /100 | #190 | Fair 95.9% |
| Liberians | 32.5 /100 | #191 | Fair 95.9% |
| Panamanians | 32.3 /100 | #192 | Fair 95.9% |
| Immigrants | Bahamas | 30.8 /100 | #193 | Fair 95.9% |
| Immigrants | Nepal | 30.0 /100 | #194 | Fair 95.9% |
| Sudanese | 28.1 /100 | #195 | Fair 95.9% |
| Apache | 27.6 /100 | #196 | Fair 95.9% |
| Immigrants | Zaire | 26.7 /100 | #197 | Fair 95.9% |
| Paraguayans | 24.8 /100 | #198 | Fair 95.9% |
| Guamanians/Chamorros | 23.5 /100 | #199 | Fair 95.9% |
| Argentineans | 23.2 /100 | #200 | Fair 95.9% |
| Immigrants | Argentina | 21.9 /100 | #201 | Fair 95.9% |
| Immigrants | Northern Africa | 21.4 /100 | #202 | Fair 95.8% |
| Comanche | 21.1 /100 | #203 | Fair 95.8% |