Immigrants from Cambodia vs Inupiat Births to Unmarried Women
COMPARE
Immigrants from Cambodia
Inupiat
Births to Unmarried Women
Births to Unmarried Women Comparison
Immigrants from Cambodia
Inupiat
34.8%
BIRTHS TO UNMARRIED WOMEN
1.6/ 100
METRIC RATING
238th/ 347
METRIC RANK
52.1%
BIRTHS TO UNMARRIED WOMEN
0.0/ 100
METRIC RATING
345th/ 347
METRIC RANK
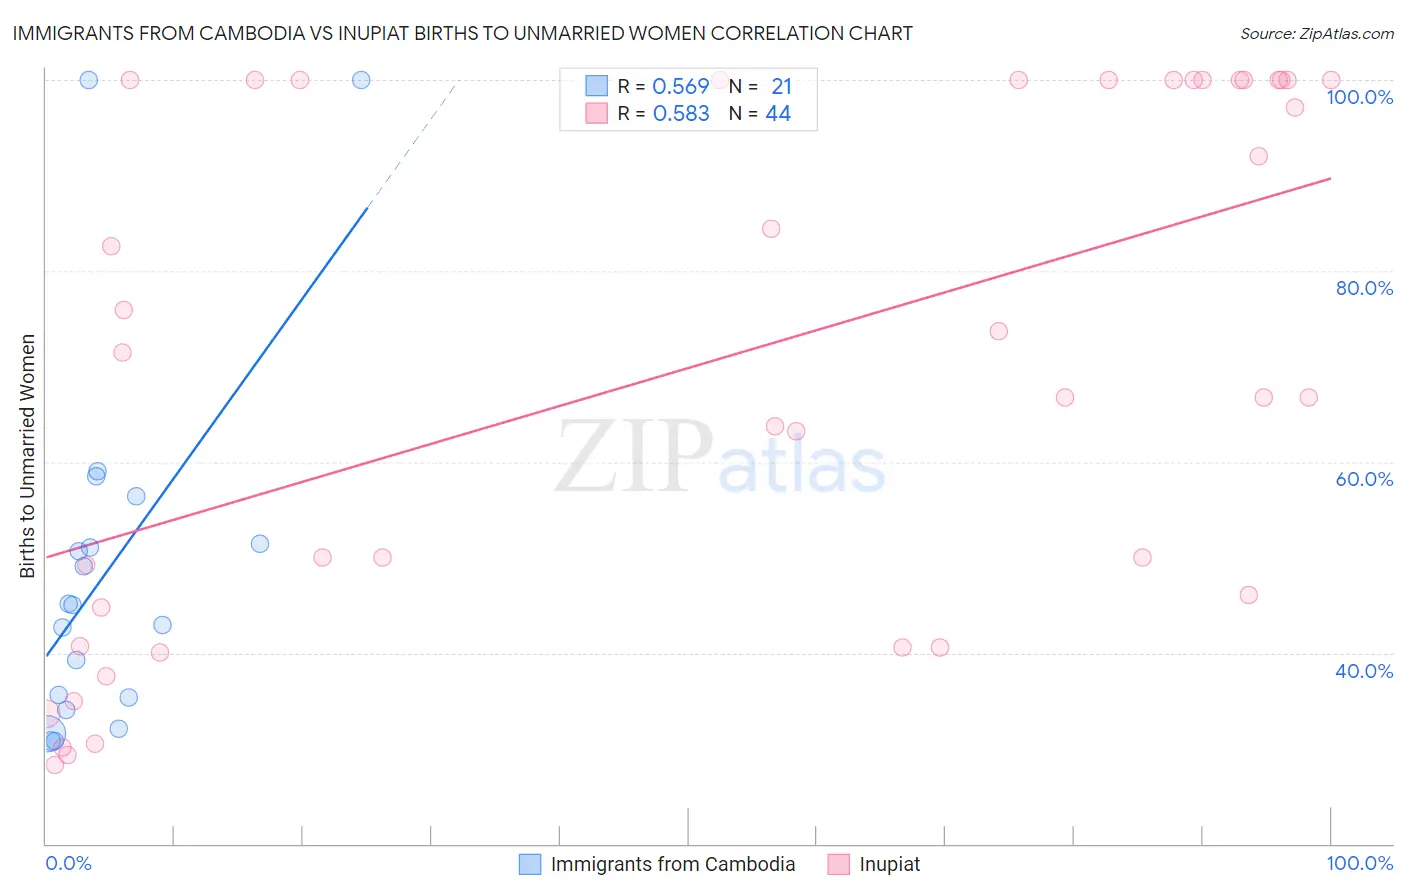
Immigrants from Cambodia vs Inupiat Births to Unmarried Women Correlation Chart
The statistical analysis conducted on geographies consisting of 198,809,651 people shows a substantial positive correlation between the proportion of Immigrants from Cambodia and percentage of births to unmarried women in the United States with a correlation coefficient (R) of 0.569 and weighted average of 34.8%. Similarly, the statistical analysis conducted on geographies consisting of 94,892,154 people shows a substantial positive correlation between the proportion of Inupiat and percentage of births to unmarried women in the United States with a correlation coefficient (R) of 0.583 and weighted average of 52.1%, a difference of 49.8%.
Births to Unmarried Women Correlation Summary
| Measurement | Immigrants from Cambodia | Inupiat |
| Minimum | 30.7% | 28.3% |
| Maximum | 100.0% | 100.0% |
| Range | 69.3% | 71.7% |
| Mean | 48.6% | 70.0% |
| Median | 45.0% | 69.1% |
| Interquartile 25% (IQ1) | 34.6% | 42.8% |
| Interquartile 75% (IQ3) | 53.9% | 100.0% |
| Interquartile Range (IQR) | 19.3% | 57.2% |
| Standard Deviation (Sample) | 19.4% | 27.2% |
| Standard Deviation (Population) | 18.9% | 26.9% |
Similar Demographics by Births to Unmarried Women
Demographics Similar to Immigrants from Cambodia by Births to Unmarried Women
In terms of births to unmarried women, the demographic groups most similar to Immigrants from Cambodia are Marshallese (34.8%, a difference of 0.060%), Immigrants from Cameroon (34.7%, a difference of 0.13%), Sierra Leonean (34.9%, a difference of 0.22%), Immigrants from Middle Africa (34.9%, a difference of 0.47%), and Immigrants from Guyana (35.0%, a difference of 0.51%).
| Demographics | Rating | Rank | Births to Unmarried Women |
| Native Hawaiians | 2.9 /100 | #231 | Tragic 34.3% |
| French Canadians | 2.5 /100 | #232 | Tragic 34.4% |
| Bangladeshis | 2.5 /100 | #233 | Tragic 34.4% |
| Immigrants | Zaire | 2.3 /100 | #234 | Tragic 34.5% |
| Immigrants | Ghana | 2.2 /100 | #235 | Tragic 34.5% |
| Immigrants | Cameroon | 1.6 /100 | #236 | Tragic 34.7% |
| Marshallese | 1.6 /100 | #237 | Tragic 34.8% |
| Immigrants | Cambodia | 1.6 /100 | #238 | Tragic 34.8% |
| Sierra Leoneans | 1.4 /100 | #239 | Tragic 34.9% |
| Immigrants | Middle Africa | 1.2 /100 | #240 | Tragic 34.9% |
| Immigrants | Guyana | 1.2 /100 | #241 | Tragic 35.0% |
| Indonesians | 1.2 /100 | #242 | Tragic 35.0% |
| Japanese | 0.9 /100 | #243 | Tragic 35.2% |
| Guyanese | 0.9 /100 | #244 | Tragic 35.2% |
| Shoshone | 0.8 /100 | #245 | Tragic 35.3% |
Demographics Similar to Inupiat by Births to Unmarried Women
In terms of births to unmarried women, the demographic groups most similar to Inupiat are Navajo (51.5%, a difference of 1.2%), Pima (51.5%, a difference of 1.2%), Menominee (51.1%, a difference of 1.9%), Hopi (50.8%, a difference of 2.5%), and Pueblo (53.7%, a difference of 3.0%).
| Demographics | Rating | Rank | Births to Unmarried Women |
| Blacks/African Americans | 0.0 /100 | #333 | Tragic 44.3% |
| Yuman | 0.0 /100 | #334 | Tragic 44.4% |
| Colville | 0.0 /100 | #335 | Tragic 45.3% |
| Puerto Ricans | 0.0 /100 | #336 | Tragic 45.7% |
| Houma | 0.0 /100 | #337 | Tragic 46.6% |
| Arapaho | 0.0 /100 | #338 | Tragic 47.1% |
| Lumbee | 0.0 /100 | #339 | Tragic 48.2% |
| Tohono O'odham | 0.0 /100 | #340 | Tragic 49.8% |
| Hopi | 0.0 /100 | #341 | Tragic 50.8% |
| Menominee | 0.0 /100 | #342 | Tragic 51.1% |
| Pima | 0.0 /100 | #343 | Tragic 51.5% |
| Navajo | 0.0 /100 | #344 | Tragic 51.5% |
| Inupiat | 0.0 /100 | #345 | Tragic 52.1% |
| Pueblo | 0.0 /100 | #346 | Tragic 53.7% |
| Yup'ik | 0.0 /100 | #347 | Tragic 56.4% |