Immigrants from Spain vs Inupiat Births to Unmarried Women
COMPARE
Immigrants from Spain
Inupiat
Births to Unmarried Women
Births to Unmarried Women Comparison
Immigrants from Spain
Inupiat
30.3%
BIRTHS TO UNMARRIED WOMEN
85.8/ 100
METRIC RATING
129th/ 347
METRIC RANK
52.1%
BIRTHS TO UNMARRIED WOMEN
0.0/ 100
METRIC RATING
345th/ 347
METRIC RANK
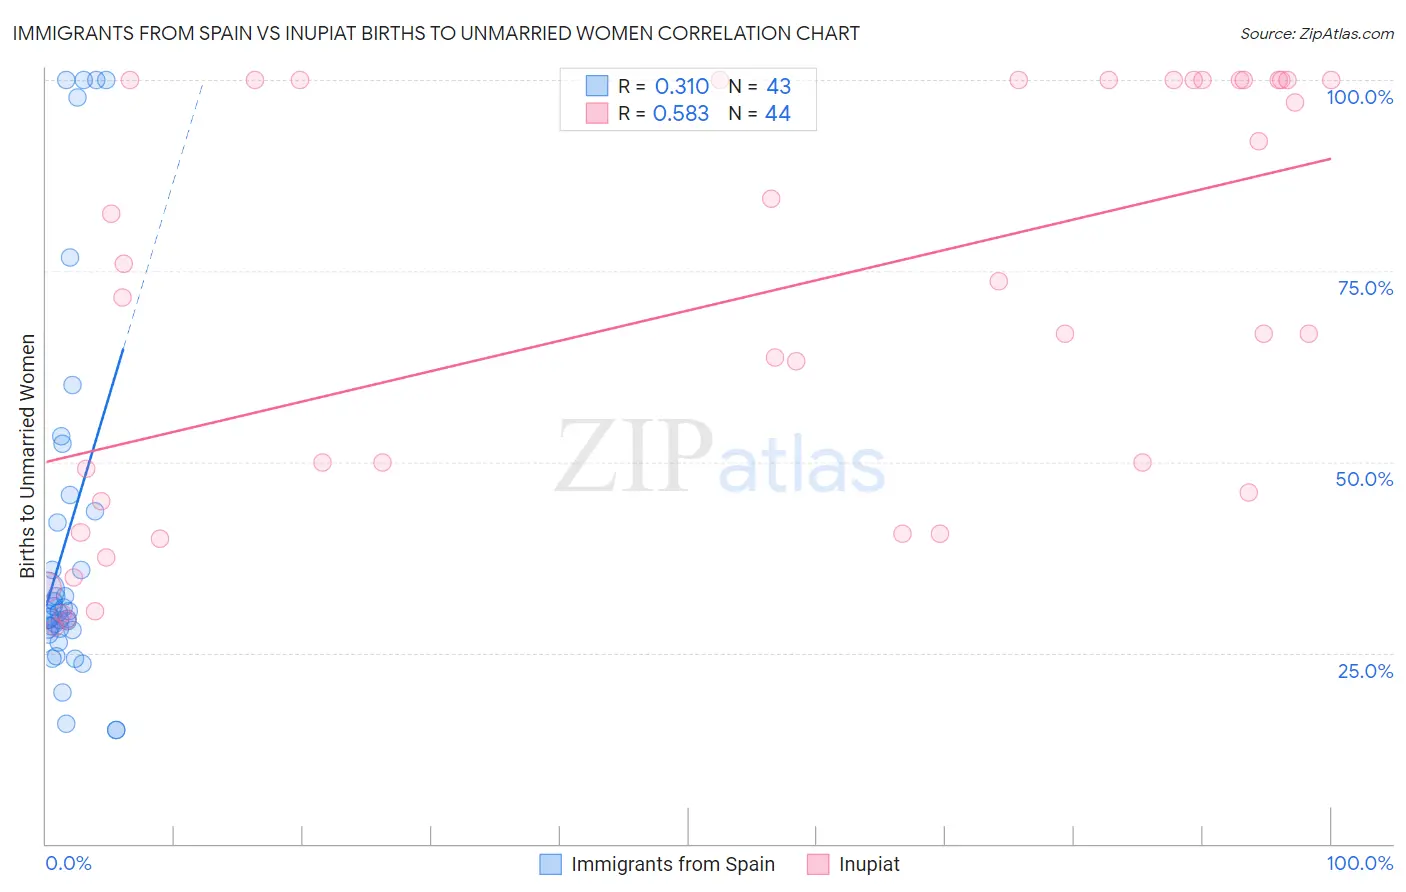
Immigrants from Spain vs Inupiat Births to Unmarried Women Correlation Chart
The statistical analysis conducted on geographies consisting of 227,898,948 people shows a mild positive correlation between the proportion of Immigrants from Spain and percentage of births to unmarried women in the United States with a correlation coefficient (R) of 0.310 and weighted average of 30.3%. Similarly, the statistical analysis conducted on geographies consisting of 94,892,154 people shows a substantial positive correlation between the proportion of Inupiat and percentage of births to unmarried women in the United States with a correlation coefficient (R) of 0.583 and weighted average of 52.1%, a difference of 71.8%.
Births to Unmarried Women Correlation Summary
| Measurement | Immigrants from Spain | Inupiat |
| Minimum | 14.9% | 28.3% |
| Maximum | 100.0% | 100.0% |
| Range | 85.1% | 71.7% |
| Mean | 40.2% | 70.0% |
| Median | 30.3% | 69.1% |
| Interquartile 25% (IQ1) | 28.0% | 42.8% |
| Interquartile 75% (IQ3) | 43.6% | 100.0% |
| Interquartile Range (IQR) | 15.6% | 57.2% |
| Standard Deviation (Sample) | 24.6% | 27.2% |
| Standard Deviation (Population) | 24.3% | 26.9% |
Similar Demographics by Births to Unmarried Women
Demographics Similar to Immigrants from Spain by Births to Unmarried Women
In terms of births to unmarried women, the demographic groups most similar to Immigrants from Spain are Immigrants from Bosnia and Herzegovina (30.3%, a difference of 0.010%), Immigrants from Zimbabwe (30.3%, a difference of 0.020%), Icelander (30.3%, a difference of 0.040%), New Zealander (30.3%, a difference of 0.060%), and Immigrants from Morocco (30.4%, a difference of 0.11%).
| Demographics | Rating | Rank | Births to Unmarried Women |
| Immigrants | Argentina | 88.7 /100 | #122 | Excellent 30.1% |
| Syrians | 88.2 /100 | #123 | Excellent 30.2% |
| Croatians | 88.0 /100 | #124 | Excellent 30.2% |
| Vietnamese | 87.7 /100 | #125 | Excellent 30.2% |
| Europeans | 87.2 /100 | #126 | Excellent 30.2% |
| Chinese | 87.1 /100 | #127 | Excellent 30.2% |
| Icelanders | 86.0 /100 | #128 | Excellent 30.3% |
| Immigrants | Spain | 85.8 /100 | #129 | Excellent 30.3% |
| Immigrants | Bosnia and Herzegovina | 85.7 /100 | #130 | Excellent 30.3% |
| Immigrants | Zimbabwe | 85.7 /100 | #131 | Excellent 30.3% |
| New Zealanders | 85.5 /100 | #132 | Excellent 30.3% |
| Immigrants | Morocco | 85.2 /100 | #133 | Excellent 30.4% |
| Immigrants | South Eastern Asia | 85.2 /100 | #134 | Excellent 30.4% |
| Brazilians | 84.8 /100 | #135 | Excellent 30.4% |
| Immigrants | Scotland | 84.6 /100 | #136 | Excellent 30.4% |
Demographics Similar to Inupiat by Births to Unmarried Women
In terms of births to unmarried women, the demographic groups most similar to Inupiat are Navajo (51.5%, a difference of 1.2%), Pima (51.5%, a difference of 1.2%), Menominee (51.1%, a difference of 1.9%), Hopi (50.8%, a difference of 2.5%), and Pueblo (53.7%, a difference of 3.0%).
| Demographics | Rating | Rank | Births to Unmarried Women |
| Blacks/African Americans | 0.0 /100 | #333 | Tragic 44.3% |
| Yuman | 0.0 /100 | #334 | Tragic 44.4% |
| Colville | 0.0 /100 | #335 | Tragic 45.3% |
| Puerto Ricans | 0.0 /100 | #336 | Tragic 45.7% |
| Houma | 0.0 /100 | #337 | Tragic 46.6% |
| Arapaho | 0.0 /100 | #338 | Tragic 47.1% |
| Lumbee | 0.0 /100 | #339 | Tragic 48.2% |
| Tohono O'odham | 0.0 /100 | #340 | Tragic 49.8% |
| Hopi | 0.0 /100 | #341 | Tragic 50.8% |
| Menominee | 0.0 /100 | #342 | Tragic 51.1% |
| Pima | 0.0 /100 | #343 | Tragic 51.5% |
| Navajo | 0.0 /100 | #344 | Tragic 51.5% |
| Inupiat | 0.0 /100 | #345 | Tragic 52.1% |
| Pueblo | 0.0 /100 | #346 | Tragic 53.7% |
| Yup'ik | 0.0 /100 | #347 | Tragic 56.4% |