Immigrants from Cambodia vs Haitian Births to Unmarried Women
COMPARE
Immigrants from Cambodia
Haitian
Births to Unmarried Women
Births to Unmarried Women Comparison
Immigrants from Cambodia
Haitians
34.8%
BIRTHS TO UNMARRIED WOMEN
1.6/ 100
METRIC RATING
238th/ 347
METRIC RANK
38.6%
BIRTHS TO UNMARRIED WOMEN
0.0/ 100
METRIC RATING
301st/ 347
METRIC RANK
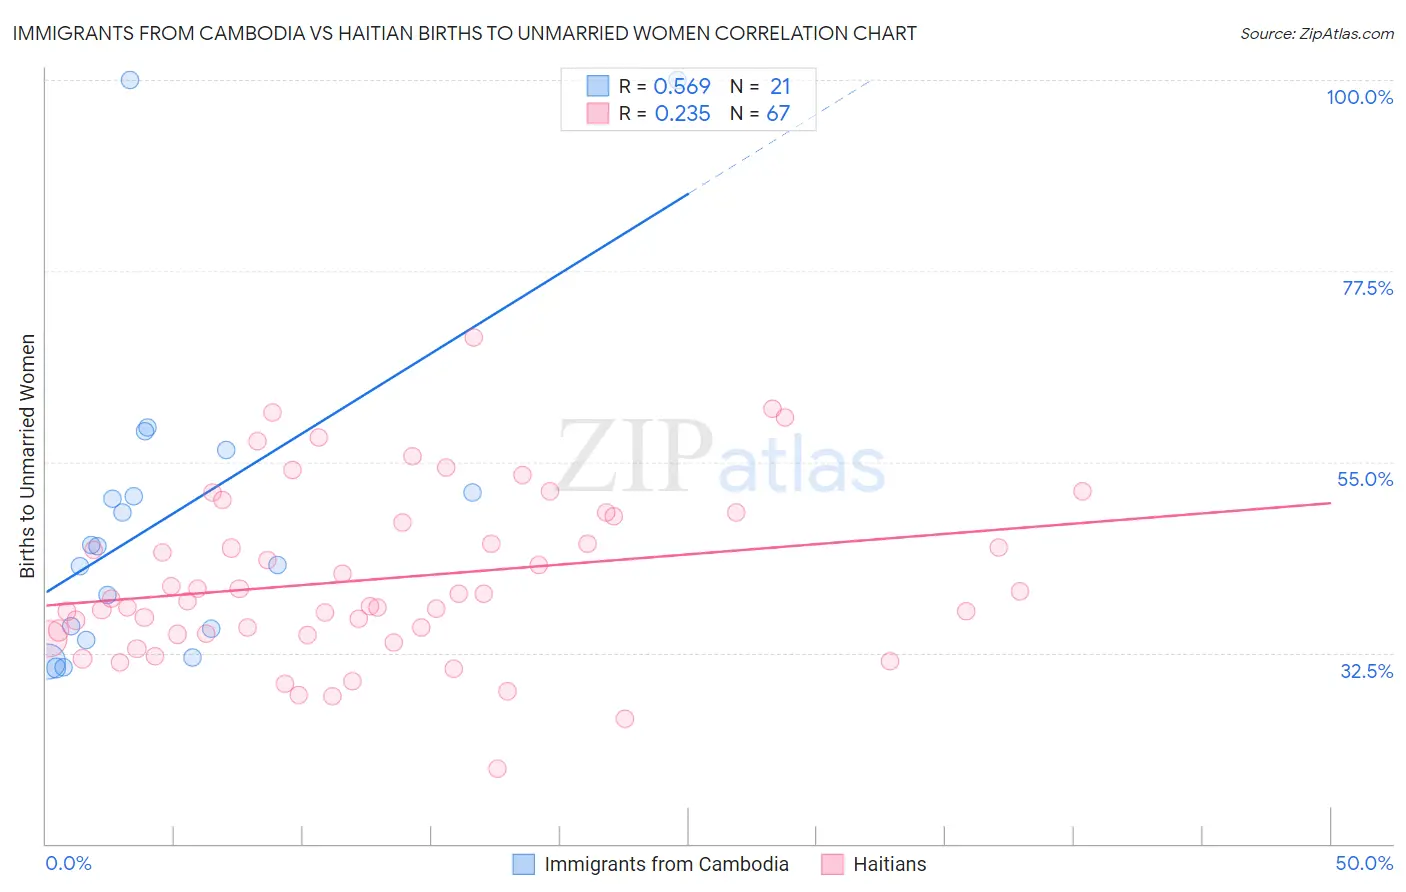
Immigrants from Cambodia vs Haitian Births to Unmarried Women Correlation Chart
The statistical analysis conducted on geographies consisting of 198,809,651 people shows a substantial positive correlation between the proportion of Immigrants from Cambodia and percentage of births to unmarried women in the United States with a correlation coefficient (R) of 0.569 and weighted average of 34.8%. Similarly, the statistical analysis conducted on geographies consisting of 274,356,790 people shows a weak positive correlation between the proportion of Haitians and percentage of births to unmarried women in the United States with a correlation coefficient (R) of 0.235 and weighted average of 38.6%, a difference of 10.9%.
Births to Unmarried Women Correlation Summary
| Measurement | Immigrants from Cambodia | Haitian |
| Minimum | 30.7% | 18.8% |
| Maximum | 100.0% | 69.7% |
| Range | 69.3% | 50.9% |
| Mean | 48.6% | 41.2% |
| Median | 45.0% | 38.9% |
| Interquartile 25% (IQ1) | 34.6% | 34.7% |
| Interquartile 75% (IQ3) | 53.9% | 48.5% |
| Interquartile Range (IQR) | 19.3% | 13.8% |
| Standard Deviation (Sample) | 19.4% | 10.0% |
| Standard Deviation (Population) | 18.9% | 9.9% |
Similar Demographics by Births to Unmarried Women
Demographics Similar to Immigrants from Cambodia by Births to Unmarried Women
In terms of births to unmarried women, the demographic groups most similar to Immigrants from Cambodia are Marshallese (34.8%, a difference of 0.060%), Immigrants from Cameroon (34.7%, a difference of 0.13%), Sierra Leonean (34.9%, a difference of 0.22%), Immigrants from Middle Africa (34.9%, a difference of 0.47%), and Immigrants from Guyana (35.0%, a difference of 0.51%).
| Demographics | Rating | Rank | Births to Unmarried Women |
| Native Hawaiians | 2.9 /100 | #231 | Tragic 34.3% |
| French Canadians | 2.5 /100 | #232 | Tragic 34.4% |
| Bangladeshis | 2.5 /100 | #233 | Tragic 34.4% |
| Immigrants | Zaire | 2.3 /100 | #234 | Tragic 34.5% |
| Immigrants | Ghana | 2.2 /100 | #235 | Tragic 34.5% |
| Immigrants | Cameroon | 1.6 /100 | #236 | Tragic 34.7% |
| Marshallese | 1.6 /100 | #237 | Tragic 34.8% |
| Immigrants | Cambodia | 1.6 /100 | #238 | Tragic 34.8% |
| Sierra Leoneans | 1.4 /100 | #239 | Tragic 34.9% |
| Immigrants | Middle Africa | 1.2 /100 | #240 | Tragic 34.9% |
| Immigrants | Guyana | 1.2 /100 | #241 | Tragic 35.0% |
| Indonesians | 1.2 /100 | #242 | Tragic 35.0% |
| Japanese | 0.9 /100 | #243 | Tragic 35.2% |
| Guyanese | 0.9 /100 | #244 | Tragic 35.2% |
| Shoshone | 0.8 /100 | #245 | Tragic 35.3% |
Demographics Similar to Haitians by Births to Unmarried Women
In terms of births to unmarried women, the demographic groups most similar to Haitians are Immigrants from West Indies (38.6%, a difference of 0.010%), Spanish American (38.6%, a difference of 0.070%), Honduran (38.7%, a difference of 0.24%), Jamaican (38.5%, a difference of 0.27%), and Dutch West Indian (38.4%, a difference of 0.47%).
| Demographics | Rating | Rank | Births to Unmarried Women |
| British West Indians | 0.0 /100 | #294 | Tragic 38.0% |
| Iroquois | 0.0 /100 | #295 | Tragic 38.2% |
| Alaska Natives | 0.0 /100 | #296 | Tragic 38.3% |
| Dutch West Indians | 0.0 /100 | #297 | Tragic 38.4% |
| Jamaicans | 0.0 /100 | #298 | Tragic 38.5% |
| Spanish Americans | 0.0 /100 | #299 | Tragic 38.6% |
| Immigrants | West Indies | 0.0 /100 | #300 | Tragic 38.6% |
| Haitians | 0.0 /100 | #301 | Tragic 38.6% |
| Hondurans | 0.0 /100 | #302 | Tragic 38.7% |
| Immigrants | Jamaica | 0.0 /100 | #303 | Tragic 38.8% |
| Yaqui | 0.0 /100 | #304 | Tragic 38.8% |
| Immigrants | Haiti | 0.0 /100 | #305 | Tragic 38.9% |
| Central American Indians | 0.0 /100 | #306 | Tragic 39.0% |
| Immigrants | Honduras | 0.0 /100 | #307 | Tragic 39.3% |
| Aleuts | 0.0 /100 | #308 | Tragic 39.3% |