Immigrants from Cabo Verde vs Brazilian Single Mother Households
COMPARE
Immigrants from Cabo Verde
Brazilian
Single Mother Households
Single Mother Households Comparison
Immigrants from Cabo Verde
Brazilians
9.6%
SINGLE MOTHER HOUSEHOLDS
0.0/ 100
METRIC RATING
345th/ 347
METRIC RANK
6.2%
SINGLE MOTHER HOUSEHOLDS
59.1/ 100
METRIC RATING
167th/ 347
METRIC RANK
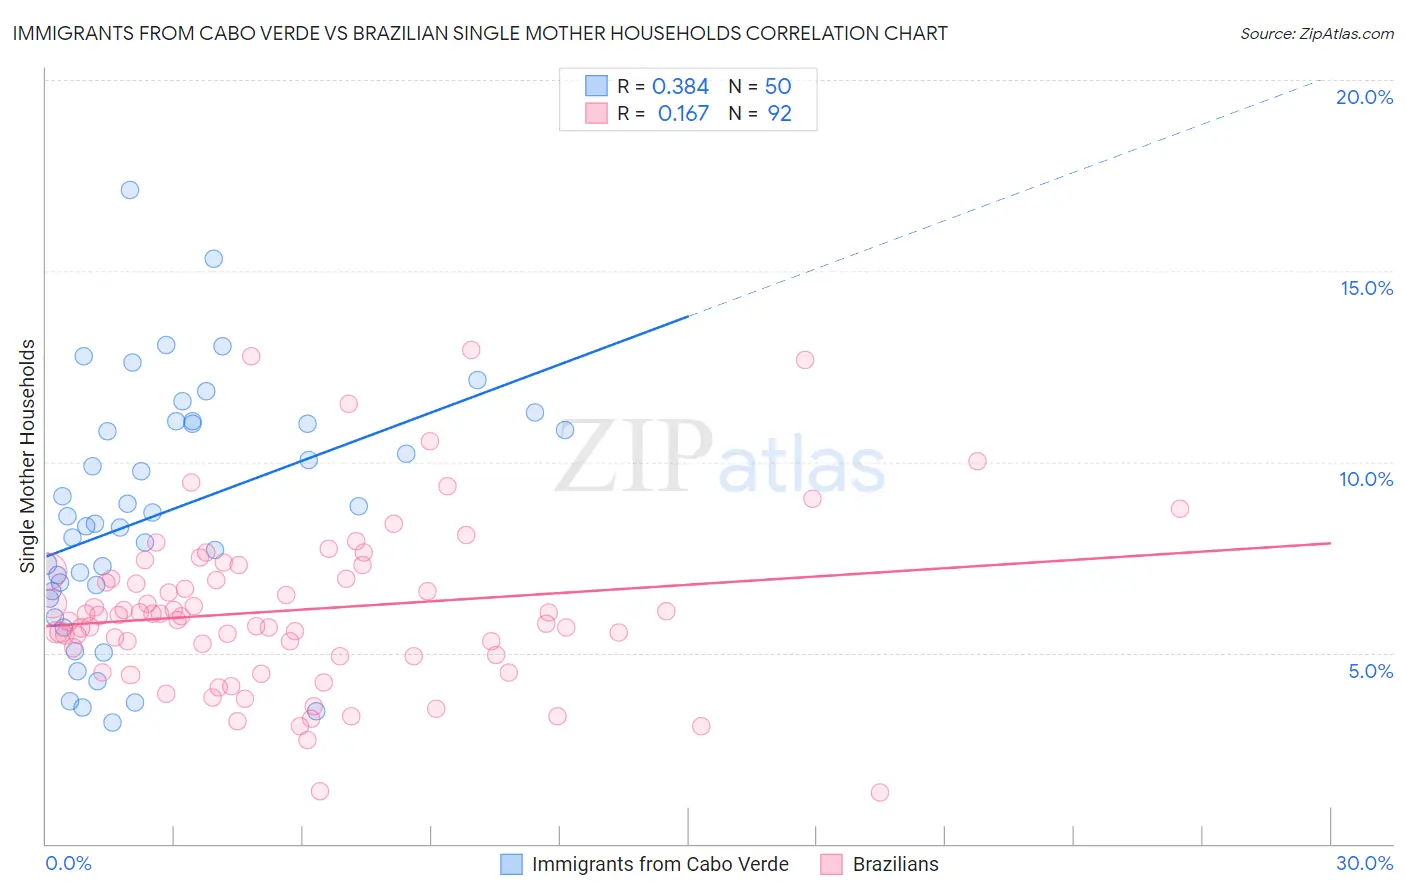
Immigrants from Cabo Verde vs Brazilian Single Mother Households Correlation Chart
The statistical analysis conducted on geographies consisting of 38,117,400 people shows a mild positive correlation between the proportion of Immigrants from Cabo Verde and percentage of single mother households in the United States with a correlation coefficient (R) of 0.384 and weighted average of 9.6%. Similarly, the statistical analysis conducted on geographies consisting of 323,280,252 people shows a poor positive correlation between the proportion of Brazilians and percentage of single mother households in the United States with a correlation coefficient (R) of 0.167 and weighted average of 6.2%, a difference of 53.3%.
Single Mother Households Correlation Summary
| Measurement | Immigrants from Cabo Verde | Brazilian |
| Minimum | 3.2% | 1.3% |
| Maximum | 17.1% | 12.9% |
| Range | 13.9% | 11.6% |
| Mean | 8.7% | 6.1% |
| Median | 8.5% | 6.0% |
| Interquartile 25% (IQ1) | 6.6% | 4.9% |
| Interquartile 75% (IQ3) | 11.0% | 7.0% |
| Interquartile Range (IQR) | 4.4% | 2.1% |
| Standard Deviation (Sample) | 3.2% | 2.2% |
| Standard Deviation (Population) | 3.2% | 2.2% |
Similar Demographics by Single Mother Households
Demographics Similar to Immigrants from Cabo Verde by Single Mother Households
In terms of single mother households, the demographic groups most similar to Immigrants from Cabo Verde are Yuman (9.6%, a difference of 0.59%), Immigrants from Dominican Republic (9.5%, a difference of 0.78%), Dominican (9.2%, a difference of 4.3%), Yup'ik (10.0%, a difference of 4.4%), and Menominee (9.2%, a difference of 4.5%).
| Demographics | Rating | Rank | Single Mother Households |
| Liberians | 0.0 /100 | #333 | Tragic 8.6% |
| Immigrants | Liberia | 0.0 /100 | #334 | Tragic 8.7% |
| Immigrants | Dominica | 0.0 /100 | #335 | Tragic 8.7% |
| Puerto Ricans | 0.0 /100 | #336 | Tragic 8.7% |
| Navajo | 0.0 /100 | #337 | Tragic 8.8% |
| Cape Verdeans | 0.0 /100 | #338 | Tragic 8.9% |
| Blacks/African Americans | 0.0 /100 | #339 | Tragic 9.0% |
| Lumbee | 0.0 /100 | #340 | Tragic 9.1% |
| Tohono O'odham | 0.0 /100 | #341 | Tragic 9.1% |
| Menominee | 0.0 /100 | #342 | Tragic 9.2% |
| Dominicans | 0.0 /100 | #343 | Tragic 9.2% |
| Immigrants | Dominican Republic | 0.0 /100 | #344 | Tragic 9.5% |
| Immigrants | Cabo Verde | 0.0 /100 | #345 | Tragic 9.6% |
| Yuman | 0.0 /100 | #346 | Tragic 9.6% |
| Yup'ik | 0.0 /100 | #347 | Tragic 10.0% |
Demographics Similar to Brazilians by Single Mother Households
In terms of single mother households, the demographic groups most similar to Brazilians are Immigrants from Chile (6.3%, a difference of 0.090%), Puget Sound Salish (6.3%, a difference of 0.11%), Immigrants from Oceania (6.3%, a difference of 0.51%), Sri Lankan (6.2%, a difference of 0.57%), and Afghan (6.3%, a difference of 0.74%).
| Demographics | Rating | Rank | Single Mother Households |
| Iraqis | 73.0 /100 | #160 | Good 6.1% |
| Immigrants | Germany | 72.4 /100 | #161 | Good 6.1% |
| Immigrants | Zimbabwe | 69.9 /100 | #162 | Good 6.2% |
| Alsatians | 68.7 /100 | #163 | Good 6.2% |
| Immigrants | Northern Africa | 68.0 /100 | #164 | Good 6.2% |
| Immigrants | Syria | 67.4 /100 | #165 | Good 6.2% |
| Sri Lankans | 63.9 /100 | #166 | Good 6.2% |
| Brazilians | 59.1 /100 | #167 | Average 6.2% |
| Immigrants | Chile | 58.3 /100 | #168 | Average 6.3% |
| Puget Sound Salish | 58.1 /100 | #169 | Average 6.3% |
| Immigrants | Oceania | 54.6 /100 | #170 | Average 6.3% |
| Afghans | 52.5 /100 | #171 | Average 6.3% |
| Immigrants | South Eastern Asia | 52.2 /100 | #172 | Average 6.3% |
| Immigrants | Vietnam | 51.5 /100 | #173 | Average 6.3% |
| Immigrants | Morocco | 50.0 /100 | #174 | Average 6.3% |