Immigrants from Burma/Myanmar vs Immigrants from Uzbekistan Family Households
COMPARE
Immigrants from Burma/Myanmar
Immigrants from Uzbekistan
Family Households
Family Households Comparison
Immigrants from Burma/Myanmar
Immigrants from Uzbekistan
62.6%
FAMILY HOUSEHOLDS
0.0/ 100
METRIC RATING
292nd/ 347
METRIC RANK
63.4%
FAMILY HOUSEHOLDS
1.5/ 100
METRIC RATING
247th/ 347
METRIC RANK
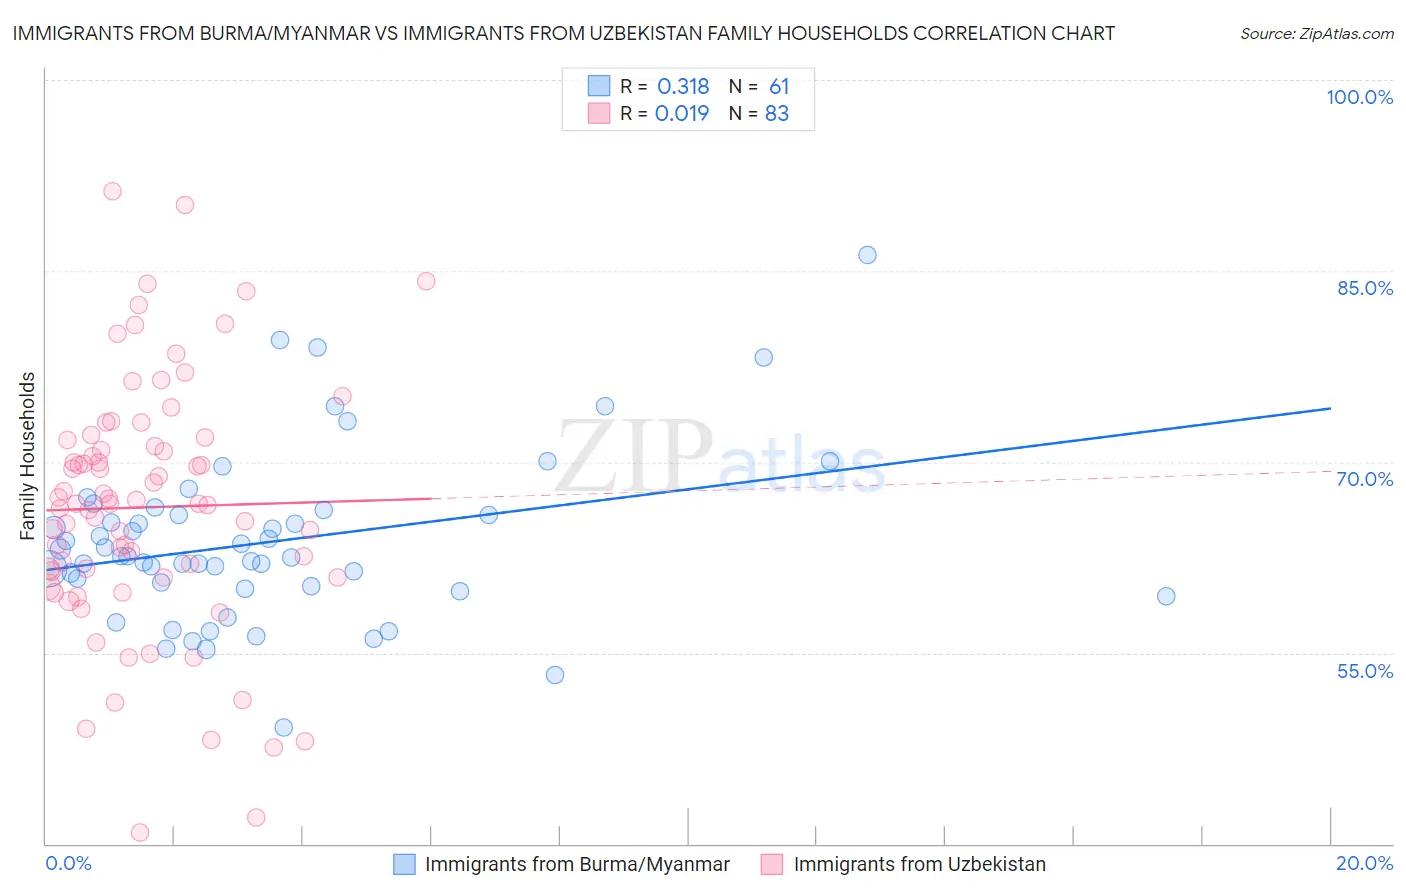
Immigrants from Burma/Myanmar vs Immigrants from Uzbekistan Family Households Correlation Chart
The statistical analysis conducted on geographies consisting of 172,273,179 people shows a mild positive correlation between the proportion of Immigrants from Burma/Myanmar and percentage of family households in the United States with a correlation coefficient (R) of 0.318 and weighted average of 62.6%. Similarly, the statistical analysis conducted on geographies consisting of 118,723,370 people shows no correlation between the proportion of Immigrants from Uzbekistan and percentage of family households in the United States with a correlation coefficient (R) of 0.019 and weighted average of 63.4%, a difference of 1.3%.
Family Households Correlation Summary
| Measurement | Immigrants from Burma/Myanmar | Immigrants from Uzbekistan |
| Minimum | 49.1% | 40.8% |
| Maximum | 86.2% | 91.2% |
| Range | 37.1% | 50.4% |
| Mean | 63.7% | 66.4% |
| Median | 62.5% | 66.7% |
| Interquartile 25% (IQ1) | 60.1% | 60.9% |
| Interquartile 75% (IQ3) | 66.0% | 71.7% |
| Interquartile Range (IQR) | 5.9% | 10.8% |
| Standard Deviation (Sample) | 6.7% | 9.9% |
| Standard Deviation (Population) | 6.6% | 9.9% |
Similar Demographics by Family Households
Demographics Similar to Immigrants from Burma/Myanmar by Family Households
In terms of family households, the demographic groups most similar to Immigrants from Burma/Myanmar are U.S. Virgin Islander (62.6%, a difference of 0.050%), Immigrants from Grenada (62.6%, a difference of 0.10%), Immigrants from Sweden (62.5%, a difference of 0.13%), Immigrants from Nepal (62.7%, a difference of 0.18%), and Barbadian (62.5%, a difference of 0.19%).
| Demographics | Rating | Rank | Family Households |
| Mongolians | 0.1 /100 | #285 | Tragic 62.8% |
| British West Indians | 0.1 /100 | #286 | Tragic 62.8% |
| Latvians | 0.1 /100 | #287 | Tragic 62.8% |
| Immigrants | Uganda | 0.1 /100 | #288 | Tragic 62.7% |
| Immigrants | Nepal | 0.1 /100 | #289 | Tragic 62.7% |
| Immigrants | Grenada | 0.0 /100 | #290 | Tragic 62.6% |
| U.S. Virgin Islanders | 0.0 /100 | #291 | Tragic 62.6% |
| Immigrants | Burma/Myanmar | 0.0 /100 | #292 | Tragic 62.6% |
| Immigrants | Sweden | 0.0 /100 | #293 | Tragic 62.5% |
| Barbadians | 0.0 /100 | #294 | Tragic 62.5% |
| Okinawans | 0.0 /100 | #295 | Tragic 62.5% |
| Slovenes | 0.0 /100 | #296 | Tragic 62.4% |
| French American Indians | 0.0 /100 | #297 | Tragic 62.4% |
| Immigrants | Spain | 0.0 /100 | #298 | Tragic 62.4% |
| Immigrants | Kuwait | 0.0 /100 | #299 | Tragic 62.4% |
Demographics Similar to Immigrants from Uzbekistan by Family Households
In terms of family households, the demographic groups most similar to Immigrants from Uzbekistan are Immigrants from Ghana (63.4%, a difference of 0.010%), Dominican (63.4%, a difference of 0.010%), Russian (63.4%, a difference of 0.020%), Eastern European (63.4%, a difference of 0.030%), and Immigrants from Dominica (63.4%, a difference of 0.030%).
| Demographics | Rating | Rank | Family Households |
| South Africans | 1.9 /100 | #240 | Tragic 63.4% |
| Immigrants | St. Vincent and the Grenadines | 1.9 /100 | #241 | Tragic 63.4% |
| Immigrants | Israel | 1.8 /100 | #242 | Tragic 63.4% |
| Immigrants | Czechoslovakia | 1.8 /100 | #243 | Tragic 63.4% |
| Eastern Europeans | 1.6 /100 | #244 | Tragic 63.4% |
| Immigrants | Dominica | 1.6 /100 | #245 | Tragic 63.4% |
| Immigrants | Ghana | 1.6 /100 | #246 | Tragic 63.4% |
| Immigrants | Uzbekistan | 1.5 /100 | #247 | Tragic 63.4% |
| Dominicans | 1.5 /100 | #248 | Tragic 63.4% |
| Russians | 1.4 /100 | #249 | Tragic 63.4% |
| Immigrants | Japan | 1.4 /100 | #250 | Tragic 63.4% |
| Taiwanese | 1.2 /100 | #251 | Tragic 63.3% |
| Bahamians | 1.1 /100 | #252 | Tragic 63.3% |
| Immigrants | Dominican Republic | 1.0 /100 | #253 | Tragic 63.3% |
| Slovaks | 1.0 /100 | #254 | Tragic 63.3% |