Immigrants from Nepal vs Liberian Single Mother Households
COMPARE
Immigrants from Nepal
Liberian
Single Mother Households
Single Mother Households Comparison
Immigrants from Nepal
Liberians
6.4%
SINGLE MOTHER HOUSEHOLDS
36.1/ 100
METRIC RATING
180th/ 347
METRIC RANK
8.6%
SINGLE MOTHER HOUSEHOLDS
0.0/ 100
METRIC RATING
333rd/ 347
METRIC RANK
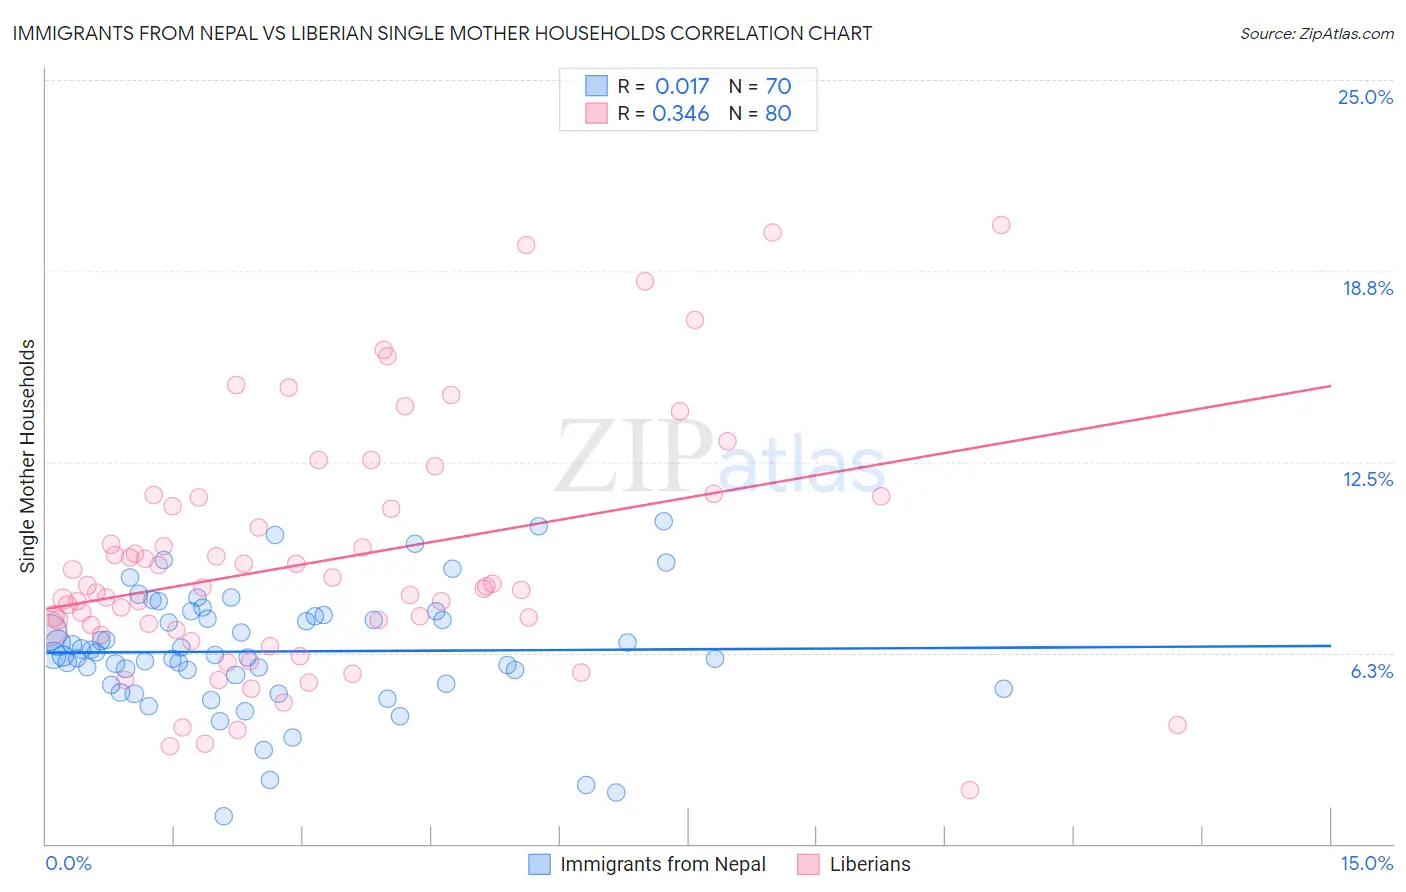
Immigrants from Nepal vs Liberian Single Mother Households Correlation Chart
The statistical analysis conducted on geographies consisting of 186,604,870 people shows no correlation between the proportion of Immigrants from Nepal and percentage of single mother households in the United States with a correlation coefficient (R) of 0.017 and weighted average of 6.4%. Similarly, the statistical analysis conducted on geographies consisting of 118,018,313 people shows a mild positive correlation between the proportion of Liberians and percentage of single mother households in the United States with a correlation coefficient (R) of 0.346 and weighted average of 8.6%, a difference of 34.8%.
Single Mother Households Correlation Summary
| Measurement | Immigrants from Nepal | Liberian |
| Minimum | 0.90% | 1.7% |
| Maximum | 10.6% | 20.2% |
| Range | 9.7% | 18.5% |
| Mean | 6.3% | 9.3% |
| Median | 6.2% | 8.4% |
| Interquartile 25% (IQ1) | 5.2% | 7.0% |
| Interquartile 75% (IQ3) | 7.5% | 11.2% |
| Interquartile Range (IQR) | 2.2% | 4.2% |
| Standard Deviation (Sample) | 1.9% | 4.0% |
| Standard Deviation (Population) | 1.9% | 3.9% |
Similar Demographics by Single Mother Households
Demographics Similar to Immigrants from Nepal by Single Mother Households
In terms of single mother households, the demographic groups most similar to Immigrants from Nepal are Spanish (6.4%, a difference of 0.32%), South American Indian (6.4%, a difference of 0.32%), Hmong (6.4%, a difference of 0.43%), Portuguese (6.4%, a difference of 0.45%), and Osage (6.4%, a difference of 0.79%).
| Demographics | Rating | Rank | Single Mother Households |
| Immigrants | Vietnam | 51.5 /100 | #173 | Average 6.3% |
| Immigrants | Morocco | 50.0 /100 | #174 | Average 6.3% |
| Marshallese | 45.8 /100 | #175 | Average 6.3% |
| Immigrants | Bosnia and Herzegovina | 44.3 /100 | #176 | Average 6.3% |
| Osage | 43.0 /100 | #177 | Average 6.4% |
| Portuguese | 40.0 /100 | #178 | Fair 6.4% |
| Hmong | 39.8 /100 | #179 | Fair 6.4% |
| Immigrants | Nepal | 36.1 /100 | #180 | Fair 6.4% |
| Spanish | 33.4 /100 | #181 | Fair 6.4% |
| South American Indians | 33.4 /100 | #182 | Fair 6.4% |
| Spaniards | 27.8 /100 | #183 | Fair 6.5% |
| Ethiopians | 26.0 /100 | #184 | Fair 6.5% |
| Ugandans | 25.6 /100 | #185 | Fair 6.5% |
| Costa Ricans | 24.8 /100 | #186 | Fair 6.5% |
| Immigrants | Afghanistan | 24.7 /100 | #187 | Fair 6.5% |
Demographics Similar to Liberians by Single Mother Households
In terms of single mother households, the demographic groups most similar to Liberians are U.S. Virgin Islander (8.6%, a difference of 0.33%), Immigrants from Liberia (8.7%, a difference of 0.80%), Immigrants from Dominica (8.7%, a difference of 1.1%), Puerto Rican (8.7%, a difference of 1.1%), and Inupiat (8.5%, a difference of 1.8%).
| Demographics | Rating | Rank | Single Mother Households |
| British West Indians | 0.0 /100 | #326 | Tragic 8.4% |
| Immigrants | Haiti | 0.0 /100 | #327 | Tragic 8.4% |
| Yakama | 0.0 /100 | #328 | Tragic 8.4% |
| Hopi | 0.0 /100 | #329 | Tragic 8.5% |
| Inupiat | 0.0 /100 | #330 | Tragic 8.5% |
| Sioux | 0.0 /100 | #331 | Tragic 8.5% |
| U.S. Virgin Islanders | 0.0 /100 | #332 | Tragic 8.6% |
| Liberians | 0.0 /100 | #333 | Tragic 8.6% |
| Immigrants | Liberia | 0.0 /100 | #334 | Tragic 8.7% |
| Immigrants | Dominica | 0.0 /100 | #335 | Tragic 8.7% |
| Puerto Ricans | 0.0 /100 | #336 | Tragic 8.7% |
| Navajo | 0.0 /100 | #337 | Tragic 8.8% |
| Cape Verdeans | 0.0 /100 | #338 | Tragic 8.9% |
| Blacks/African Americans | 0.0 /100 | #339 | Tragic 9.0% |
| Lumbee | 0.0 /100 | #340 | Tragic 9.1% |