Immigrants from Northern Europe vs Immigrants from Moldova Single Mother Households
COMPARE
Immigrants from Northern Europe
Immigrants from Moldova
Single Mother Households
Single Mother Households Comparison
Immigrants from Northern Europe
Immigrants from Moldova
5.3%
SINGLE MOTHER HOUSEHOLDS
99.7/ 100
METRIC RATING
35th/ 347
METRIC RANK
5.6%
SINGLE MOTHER HOUSEHOLDS
97.9/ 100
METRIC RATING
81st/ 347
METRIC RANK
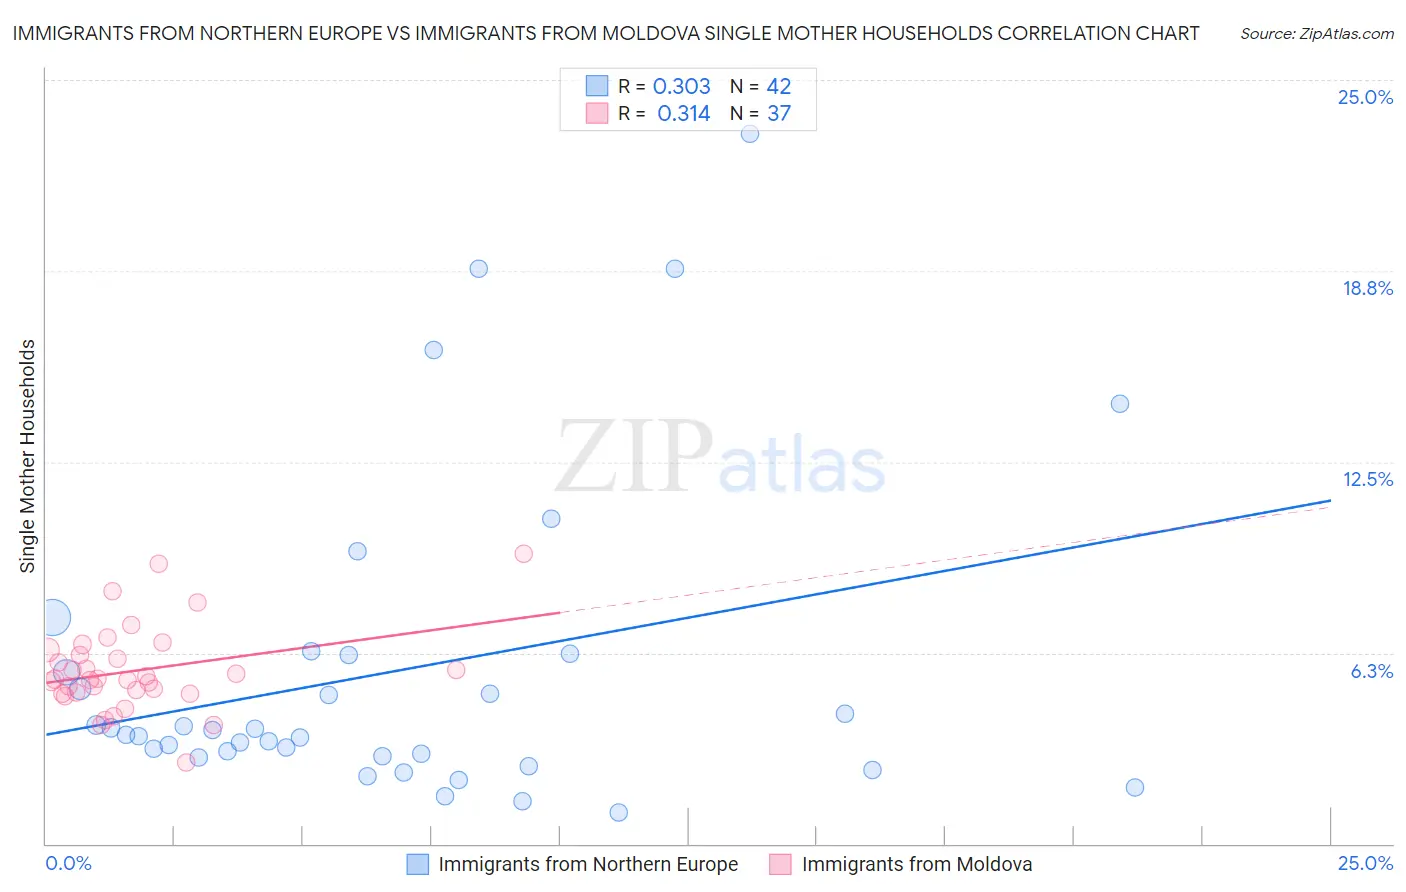
Immigrants from Northern Europe vs Immigrants from Moldova Single Mother Households Correlation Chart
The statistical analysis conducted on geographies consisting of 474,819,920 people shows a mild positive correlation between the proportion of Immigrants from Northern Europe and percentage of single mother households in the United States with a correlation coefficient (R) of 0.303 and weighted average of 5.3%. Similarly, the statistical analysis conducted on geographies consisting of 124,294,773 people shows a mild positive correlation between the proportion of Immigrants from Moldova and percentage of single mother households in the United States with a correlation coefficient (R) of 0.314 and weighted average of 5.6%, a difference of 6.3%.
Single Mother Households Correlation Summary
| Measurement | Immigrants from Northern Europe | Immigrants from Moldova |
| Minimum | 1.0% | 2.7% |
| Maximum | 23.2% | 9.5% |
| Range | 22.2% | 6.8% |
| Mean | 5.6% | 5.7% |
| Median | 3.6% | 5.4% |
| Interquartile 25% (IQ1) | 2.9% | 4.9% |
| Interquartile 75% (IQ3) | 6.2% | 6.3% |
| Interquartile Range (IQR) | 3.3% | 1.3% |
| Standard Deviation (Sample) | 5.2% | 1.4% |
| Standard Deviation (Population) | 5.1% | 1.4% |
Similar Demographics by Single Mother Households
Demographics Similar to Immigrants from Northern Europe by Single Mother Households
In terms of single mother households, the demographic groups most similar to Immigrants from Northern Europe are Bulgarian (5.3%, a difference of 0.040%), Immigrants from Switzerland (5.3%, a difference of 0.060%), Immigrants from Czechoslovakia (5.3%, a difference of 0.20%), Immigrants from Belgium (5.3%, a difference of 0.35%), and Cambodian (5.3%, a difference of 0.44%).
| Demographics | Rating | Rank | Single Mother Households |
| Russians | 99.7 /100 | #28 | Exceptional 5.3% |
| Latvians | 99.7 /100 | #29 | Exceptional 5.3% |
| Burmese | 99.7 /100 | #30 | Exceptional 5.3% |
| Immigrants | Korea | 99.7 /100 | #31 | Exceptional 5.3% |
| Cambodians | 99.7 /100 | #32 | Exceptional 5.3% |
| Immigrants | Switzerland | 99.7 /100 | #33 | Exceptional 5.3% |
| Bulgarians | 99.7 /100 | #34 | Exceptional 5.3% |
| Immigrants | Northern Europe | 99.7 /100 | #35 | Exceptional 5.3% |
| Immigrants | Czechoslovakia | 99.7 /100 | #36 | Exceptional 5.3% |
| Immigrants | Belgium | 99.7 /100 | #37 | Exceptional 5.3% |
| Immigrants | Serbia | 99.6 /100 | #38 | Exceptional 5.4% |
| Immigrants | Sweden | 99.6 /100 | #39 | Exceptional 5.4% |
| Estonians | 99.6 /100 | #40 | Exceptional 5.4% |
| Immigrants | Greece | 99.5 /100 | #41 | Exceptional 5.4% |
| Macedonians | 99.5 /100 | #42 | Exceptional 5.4% |
Demographics Similar to Immigrants from Moldova by Single Mother Households
In terms of single mother households, the demographic groups most similar to Immigrants from Moldova are Czech (5.6%, a difference of 0.0%), Immigrants from Sri Lanka (5.6%, a difference of 0.11%), Immigrants from Malaysia (5.7%, a difference of 0.21%), Immigrants from Hungary (5.7%, a difference of 0.24%), and Swiss (5.6%, a difference of 0.31%).
| Demographics | Rating | Rank | Single Mother Households |
| Immigrants | North America | 98.3 /100 | #74 | Exceptional 5.6% |
| Slovenes | 98.3 /100 | #75 | Exceptional 5.6% |
| New Zealanders | 98.2 /100 | #76 | Exceptional 5.6% |
| Romanians | 98.1 /100 | #77 | Exceptional 5.6% |
| Swiss | 98.1 /100 | #78 | Exceptional 5.6% |
| Immigrants | Sri Lanka | 98.0 /100 | #79 | Exceptional 5.6% |
| Czechs | 97.9 /100 | #80 | Exceptional 5.6% |
| Immigrants | Moldova | 97.9 /100 | #81 | Exceptional 5.6% |
| Immigrants | Malaysia | 97.8 /100 | #82 | Exceptional 5.7% |
| Immigrants | Hungary | 97.8 /100 | #83 | Exceptional 5.7% |
| Carpatho Rusyns | 97.7 /100 | #84 | Exceptional 5.7% |
| Hungarians | 97.6 /100 | #85 | Exceptional 5.7% |
| Finns | 97.6 /100 | #86 | Exceptional 5.7% |
| Immigrants | Turkey | 97.5 /100 | #87 | Exceptional 5.7% |
| Israelis | 97.4 /100 | #88 | Exceptional 5.7% |