Immigrants from Burma/Myanmar vs Yup'ik Divorced or Separated
COMPARE
Immigrants from Burma/Myanmar
Yup'ik
Divorced or Separated
Divorced or Separated Comparison
Immigrants from Burma/Myanmar
Yup'ik
12.1%
DIVORCED OR SEPARATED
30.4/ 100
METRIC RATING
196th/ 347
METRIC RANK
10.3%
DIVORCED OR SEPARATED
100.0/ 100
METRIC RATING
9th/ 347
METRIC RANK
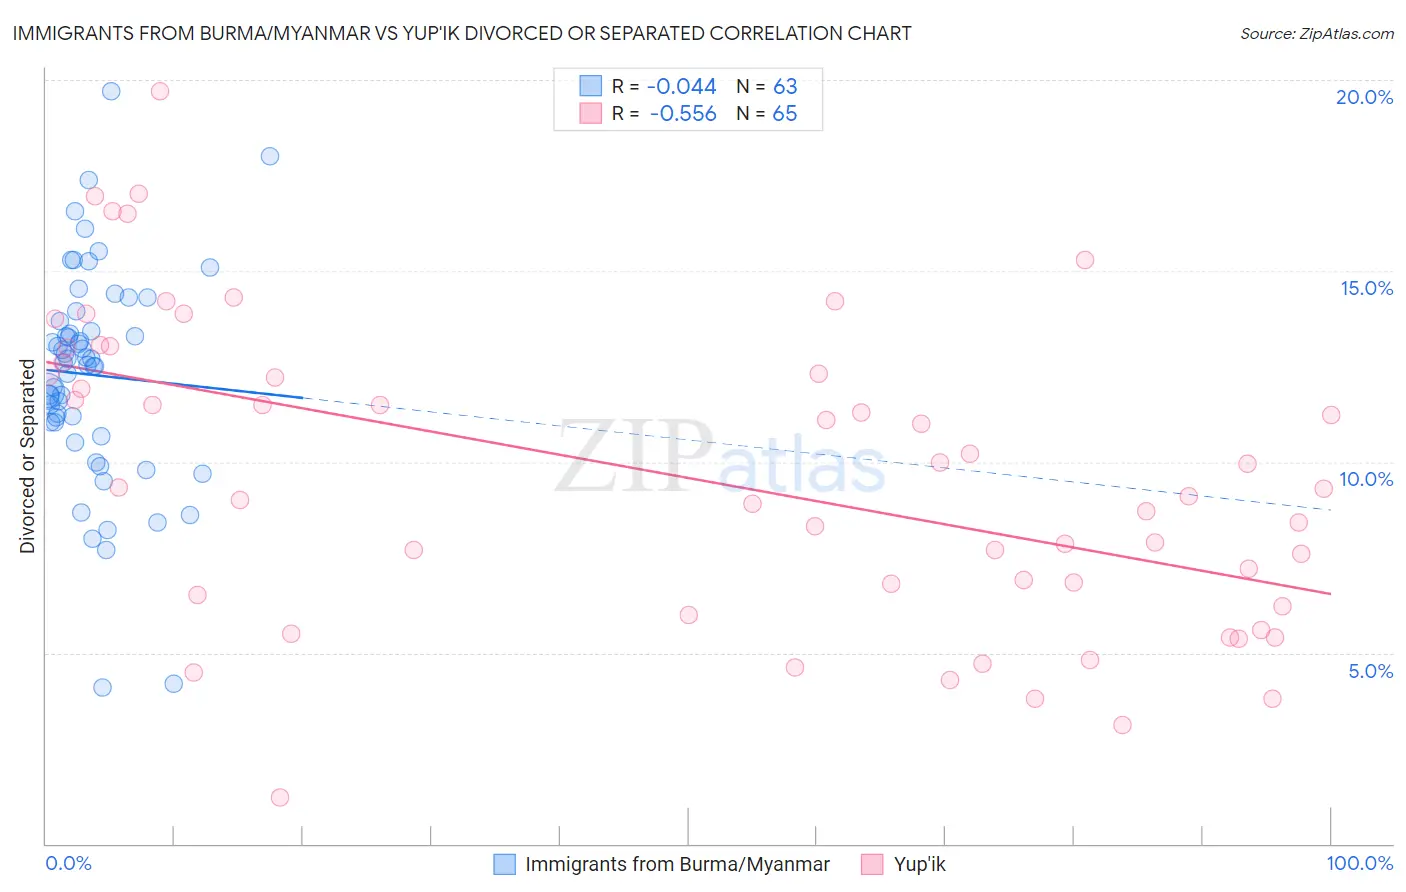
Immigrants from Burma/Myanmar vs Yup'ik Divorced or Separated Correlation Chart
The statistical analysis conducted on geographies consisting of 172,295,998 people shows no correlation between the proportion of Immigrants from Burma/Myanmar and percentage of population currently divorced or separated in the United States with a correlation coefficient (R) of -0.044 and weighted average of 12.1%. Similarly, the statistical analysis conducted on geographies consisting of 39,962,482 people shows a substantial negative correlation between the proportion of Yup'ik and percentage of population currently divorced or separated in the United States with a correlation coefficient (R) of -0.556 and weighted average of 10.3%, a difference of 18.1%.
Divorced or Separated Correlation Summary
| Measurement | Immigrants from Burma/Myanmar | Yup'ik |
| Minimum | 4.1% | 1.2% |
| Maximum | 19.7% | 19.7% |
| Range | 15.6% | 18.5% |
| Mean | 12.3% | 9.6% |
| Median | 12.6% | 9.3% |
| Interquartile 25% (IQ1) | 11.0% | 6.4% |
| Interquartile 75% (IQ3) | 13.7% | 12.5% |
| Interquartile Range (IQR) | 2.7% | 6.1% |
| Standard Deviation (Sample) | 2.8% | 4.0% |
| Standard Deviation (Population) | 2.8% | 4.0% |
Similar Demographics by Divorced or Separated
Demographics Similar to Immigrants from Burma/Myanmar by Divorced or Separated
In terms of divorced or separated, the demographic groups most similar to Immigrants from Burma/Myanmar are Immigrants from Africa (12.1%, a difference of 0.0%), Nigerian (12.1%, a difference of 0.010%), Immigrants from England (12.1%, a difference of 0.040%), Central American (12.1%, a difference of 0.040%), and Immigrants from Eritrea (12.1%, a difference of 0.060%).
| Demographics | Rating | Rank | Divorced or Separated |
| Sierra Leoneans | 35.5 /100 | #189 | Fair 12.1% |
| Moroccans | 34.8 /100 | #190 | Fair 12.1% |
| Swedes | 34.4 /100 | #191 | Fair 12.1% |
| Norwegians | 33.2 /100 | #192 | Fair 12.1% |
| Immigrants | Thailand | 32.5 /100 | #193 | Fair 12.1% |
| Immigrants | Eritrea | 31.9 /100 | #194 | Fair 12.1% |
| Immigrants | England | 31.4 /100 | #195 | Fair 12.1% |
| Immigrants | Burma/Myanmar | 30.4 /100 | #196 | Fair 12.1% |
| Immigrants | Africa | 30.3 /100 | #197 | Fair 12.1% |
| Nigerians | 30.1 /100 | #198 | Fair 12.1% |
| Central Americans | 29.4 /100 | #199 | Fair 12.1% |
| South Americans | 28.6 /100 | #200 | Fair 12.2% |
| Guatemalans | 26.9 /100 | #201 | Fair 12.2% |
| Portuguese | 23.5 /100 | #202 | Fair 12.2% |
| Immigrants | Guatemala | 23.2 /100 | #203 | Fair 12.2% |
Demographics Similar to Yup'ik by Divorced or Separated
In terms of divorced or separated, the demographic groups most similar to Yup'ik are Immigrants from Eastern Asia (10.2%, a difference of 0.44%), Immigrants from Singapore (10.3%, a difference of 0.53%), Thai (10.2%, a difference of 0.78%), Indian (Asian) (10.2%, a difference of 0.83%), and Immigrants from South Central Asia (10.4%, a difference of 1.5%).
| Demographics | Rating | Rank | Divorced or Separated |
| Filipinos | 100.0 /100 | #2 | Exceptional 9.9% |
| Immigrants | Hong Kong | 100.0 /100 | #3 | Exceptional 10.0% |
| Immigrants | China | 100.0 /100 | #4 | Exceptional 10.0% |
| Immigrants | India | 100.0 /100 | #5 | Exceptional 10.1% |
| Indians (Asian) | 100.0 /100 | #6 | Exceptional 10.2% |
| Thais | 100.0 /100 | #7 | Exceptional 10.2% |
| Immigrants | Eastern Asia | 100.0 /100 | #8 | Exceptional 10.2% |
| Yup'ik | 100.0 /100 | #9 | Exceptional 10.3% |
| Immigrants | Singapore | 100.0 /100 | #10 | Exceptional 10.3% |
| Immigrants | South Central Asia | 100.0 /100 | #11 | Exceptional 10.4% |
| Okinawans | 100.0 /100 | #12 | Exceptional 10.5% |
| Cypriots | 100.0 /100 | #13 | Exceptional 10.5% |
| Assyrians/Chaldeans/Syriacs | 100.0 /100 | #14 | Exceptional 10.6% |
| Immigrants | Armenia | 100.0 /100 | #15 | Exceptional 10.6% |
| Immigrants | Korea | 100.0 /100 | #16 | Exceptional 10.6% |