Filipino vs Dutch West Indian Single Father Households
COMPARE
Filipino
Dutch West Indian
Single Father Households
Single Father Households Comparison
Filipinos
Dutch West Indians
1.8%
SINGLE FATHER HOUSEHOLDS
100.0/ 100
METRIC RATING
3rd/ 347
METRIC RANK
2.6%
SINGLE FATHER HOUSEHOLDS
0.1/ 100
METRIC RATING
282nd/ 347
METRIC RANK
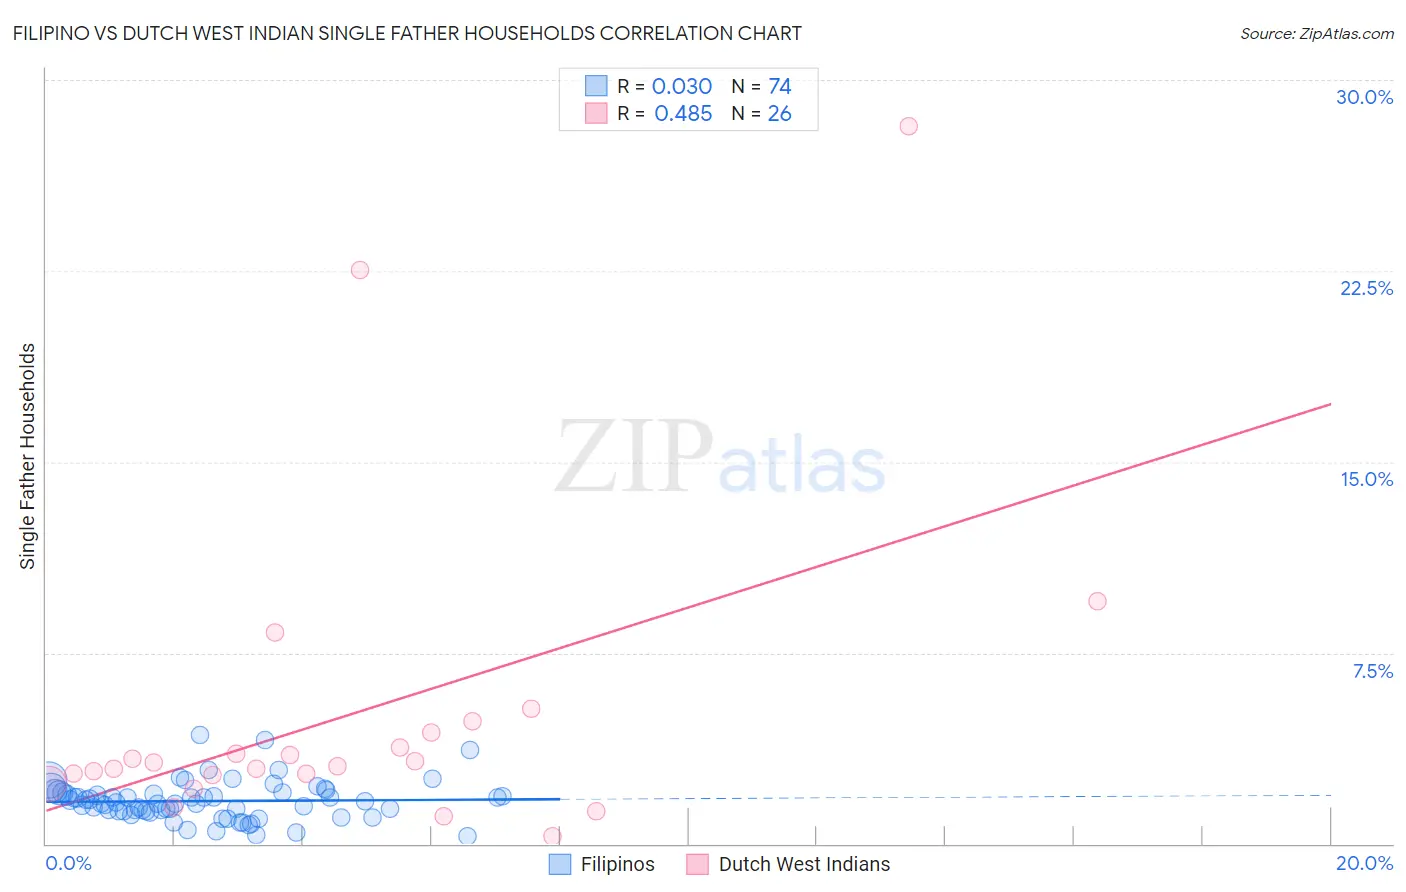
Filipino vs Dutch West Indian Single Father Households Correlation Chart
The statistical analysis conducted on geographies consisting of 252,994,105 people shows no correlation between the proportion of Filipinos and percentage of single father households in the United States with a correlation coefficient (R) of 0.030 and weighted average of 1.8%. Similarly, the statistical analysis conducted on geographies consisting of 85,485,397 people shows a moderate positive correlation between the proportion of Dutch West Indians and percentage of single father households in the United States with a correlation coefficient (R) of 0.485 and weighted average of 2.6%, a difference of 46.4%.
Single Father Households Correlation Summary
| Measurement | Filipino | Dutch West Indian |
| Minimum | 0.31% | 0.30% |
| Maximum | 4.3% | 28.2% |
| Range | 4.0% | 27.9% |
| Mean | 1.7% | 5.1% |
| Median | 1.6% | 3.1% |
| Interquartile 25% (IQ1) | 1.3% | 2.7% |
| Interquartile 75% (IQ3) | 2.0% | 4.4% |
| Interquartile Range (IQR) | 0.72% | 1.6% |
| Standard Deviation (Sample) | 0.76% | 6.3% |
| Standard Deviation (Population) | 0.75% | 6.2% |
Similar Demographics by Single Father Households
Demographics Similar to Filipinos by Single Father Households
In terms of single father households, the demographic groups most similar to Filipinos are Immigrants from Israel (1.8%, a difference of 0.42%), Soviet Union (1.8%, a difference of 0.46%), Immigrants from Uzbekistan (1.8%, a difference of 0.66%), Immigrants from Hong Kong (1.8%, a difference of 1.6%), and Immigrants from Taiwan (1.8%, a difference of 2.0%).
| Demographics | Rating | Rank | Single Father Households |
| Soviet Union | 100.0 /100 | #1 | Exceptional 1.8% |
| Immigrants | Israel | 100.0 /100 | #2 | Exceptional 1.8% |
| Filipinos | 100.0 /100 | #3 | Exceptional 1.8% |
| Immigrants | Uzbekistan | 100.0 /100 | #4 | Exceptional 1.8% |
| Immigrants | Hong Kong | 100.0 /100 | #5 | Exceptional 1.8% |
| Immigrants | Taiwan | 100.0 /100 | #6 | Exceptional 1.8% |
| Cypriots | 100.0 /100 | #7 | Exceptional 1.8% |
| Immigrants | Ireland | 100.0 /100 | #8 | Exceptional 1.8% |
| Immigrants | China | 100.0 /100 | #9 | Exceptional 1.8% |
| Okinawans | 100.0 /100 | #10 | Exceptional 1.9% |
| Immigrants | Belarus | 100.0 /100 | #11 | Exceptional 1.9% |
| Immigrants | Greece | 100.0 /100 | #12 | Exceptional 1.9% |
| Immigrants | Singapore | 100.0 /100 | #13 | Exceptional 1.9% |
| Immigrants | Lithuania | 100.0 /100 | #14 | Exceptional 1.9% |
| Immigrants | Eastern Asia | 100.0 /100 | #15 | Exceptional 1.9% |
Demographics Similar to Dutch West Indians by Single Father Households
In terms of single father households, the demographic groups most similar to Dutch West Indians are Nicaraguan (2.6%, a difference of 0.050%), Immigrants from Portugal (2.6%, a difference of 0.060%), Samoan (2.6%, a difference of 0.61%), Cherokee (2.6%, a difference of 0.65%), and Immigrants from Nicaragua (2.7%, a difference of 0.69%).
| Demographics | Rating | Rank | Single Father Households |
| Immigrants | Dominican Republic | 0.2 /100 | #275 | Tragic 2.6% |
| Immigrants | Haiti | 0.1 /100 | #276 | Tragic 2.6% |
| Shoshone | 0.1 /100 | #277 | Tragic 2.6% |
| Cherokee | 0.1 /100 | #278 | Tragic 2.6% |
| Samoans | 0.1 /100 | #279 | Tragic 2.6% |
| Immigrants | Portugal | 0.1 /100 | #280 | Tragic 2.6% |
| Nicaraguans | 0.1 /100 | #281 | Tragic 2.6% |
| Dutch West Indians | 0.1 /100 | #282 | Tragic 2.6% |
| Immigrants | Nicaragua | 0.1 /100 | #283 | Tragic 2.7% |
| Hawaiians | 0.1 /100 | #284 | Tragic 2.7% |
| Ottawa | 0.1 /100 | #285 | Tragic 2.7% |
| Immigrants | Cuba | 0.1 /100 | #286 | Tragic 2.7% |
| Central American Indians | 0.0 /100 | #287 | Tragic 2.7% |
| Immigrants | Cambodia | 0.0 /100 | #288 | Tragic 2.7% |
| Tlingit-Haida | 0.0 /100 | #289 | Tragic 2.7% |