Immigrants from Jordan vs Native/Alaskan Married-couple Households
COMPARE
Immigrants from Jordan
Native/Alaskan
Married-couple Households
Married-couple Households Comparison
Immigrants from Jordan
Natives/Alaskans
47.7%
MARRIED-COUPLE HOUSEHOLDS
94.1/ 100
METRIC RATING
109th/ 347
METRIC RANK
43.5%
MARRIED-COUPLE HOUSEHOLDS
0.1/ 100
METRIC RATING
267th/ 347
METRIC RANK
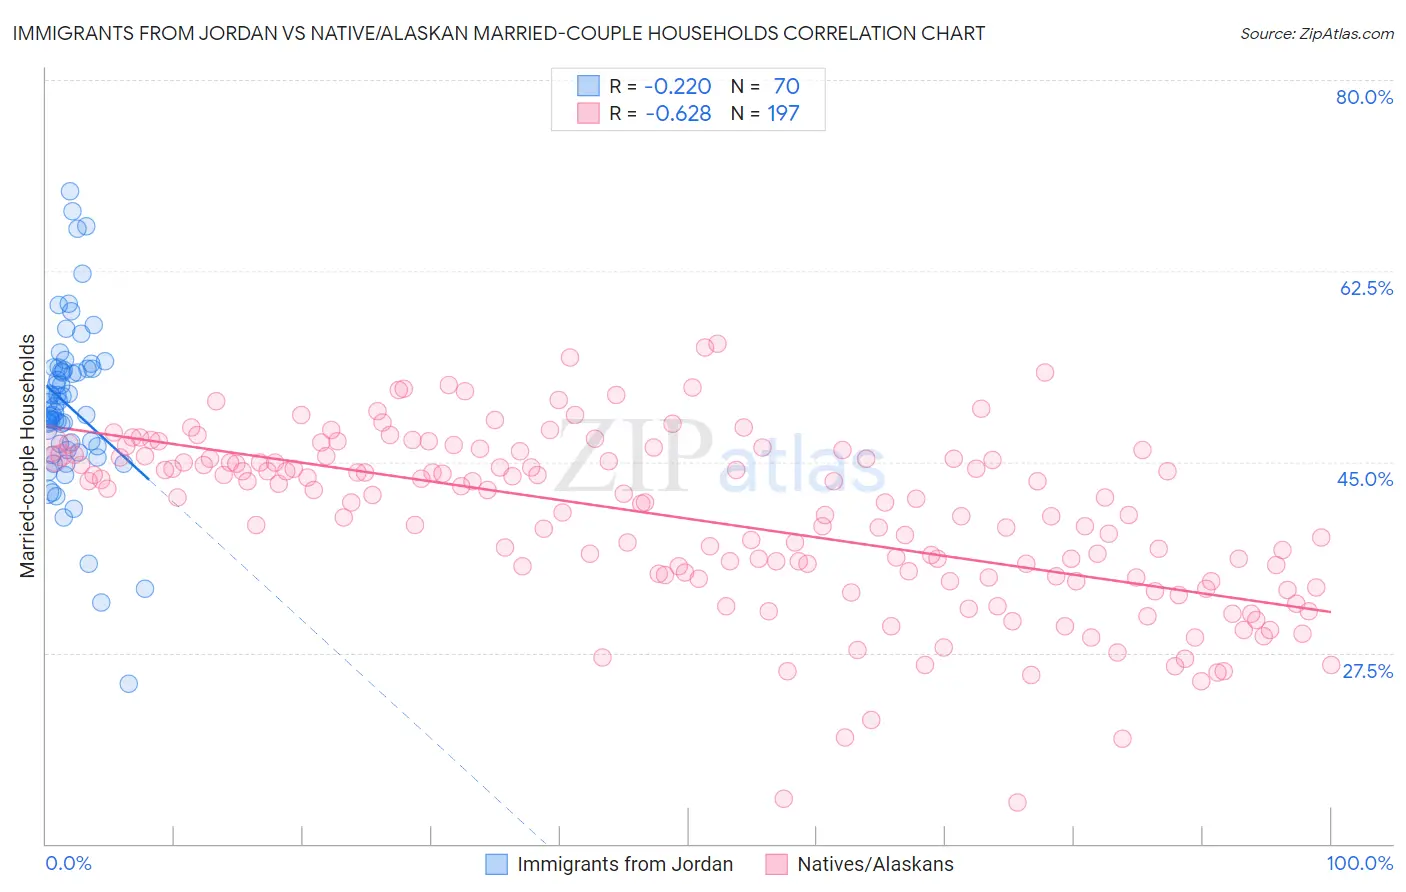
Immigrants from Jordan vs Native/Alaskan Married-couple Households Correlation Chart
The statistical analysis conducted on geographies consisting of 181,252,999 people shows a weak negative correlation between the proportion of Immigrants from Jordan and percentage of married-couple family households in the United States with a correlation coefficient (R) of -0.220 and weighted average of 47.7%. Similarly, the statistical analysis conducted on geographies consisting of 512,631,690 people shows a significant negative correlation between the proportion of Natives/Alaskans and percentage of married-couple family households in the United States with a correlation coefficient (R) of -0.628 and weighted average of 43.5%, a difference of 9.7%.
Married-couple Households Correlation Summary
| Measurement | Immigrants from Jordan | Native/Alaskan |
| Minimum | 24.7% | 13.8% |
| Maximum | 69.8% | 55.8% |
| Range | 45.1% | 42.1% |
| Mean | 50.1% | 39.8% |
| Median | 49.9% | 41.7% |
| Interquartile 25% (IQ1) | 46.0% | 34.5% |
| Interquartile 75% (IQ3) | 53.6% | 45.5% |
| Interquartile Range (IQR) | 7.5% | 11.0% |
| Standard Deviation (Sample) | 7.7% | 7.9% |
| Standard Deviation (Population) | 7.7% | 7.9% |
Similar Demographics by Married-couple Households
Demographics Similar to Immigrants from Jordan by Married-couple Households
In terms of married-couple households, the demographic groups most similar to Immigrants from Jordan are Macedonian (47.6%, a difference of 0.020%), Syrian (47.6%, a difference of 0.030%), Peruvian (47.6%, a difference of 0.040%), Immigrants from Japan (47.7%, a difference of 0.050%), and Venezuelan (47.6%, a difference of 0.050%).
| Demographics | Rating | Rank | Married-couple Households |
| Slavs | 96.0 /100 | #102 | Exceptional 47.8% |
| Hawaiians | 96.0 /100 | #103 | Exceptional 47.8% |
| Immigrants | South Africa | 96.0 /100 | #104 | Exceptional 47.8% |
| Immigrants | Czechoslovakia | 95.5 /100 | #105 | Exceptional 47.8% |
| Portuguese | 95.5 /100 | #106 | Exceptional 47.8% |
| Estonians | 94.7 /100 | #107 | Exceptional 47.7% |
| Immigrants | Japan | 94.4 /100 | #108 | Exceptional 47.7% |
| Immigrants | Jordan | 94.1 /100 | #109 | Exceptional 47.7% |
| Macedonians | 93.9 /100 | #110 | Exceptional 47.6% |
| Syrians | 93.9 /100 | #111 | Exceptional 47.6% |
| Peruvians | 93.8 /100 | #112 | Exceptional 47.6% |
| Venezuelans | 93.8 /100 | #113 | Exceptional 47.6% |
| Immigrants | Europe | 93.7 /100 | #114 | Exceptional 47.6% |
| Slovaks | 92.9 /100 | #115 | Exceptional 47.6% |
| Argentineans | 92.5 /100 | #116 | Exceptional 47.5% |
Demographics Similar to Natives/Alaskans by Married-couple Households
In terms of married-couple households, the demographic groups most similar to Natives/Alaskans are Ecuadorian (43.5%, a difference of 0.050%), Moroccan (43.5%, a difference of 0.090%), Immigrants from Burma/Myanmar (43.4%, a difference of 0.10%), Bangladeshi (43.5%, a difference of 0.17%), and Cree (43.6%, a difference of 0.29%).
| Demographics | Rating | Rank | Married-couple Households |
| Immigrants | Cameroon | 0.2 /100 | #260 | Tragic 43.7% |
| Alaskan Athabascans | 0.2 /100 | #261 | Tragic 43.6% |
| Vietnamese | 0.2 /100 | #262 | Tragic 43.6% |
| Cree | 0.1 /100 | #263 | Tragic 43.6% |
| Bangladeshis | 0.1 /100 | #264 | Tragic 43.5% |
| Moroccans | 0.1 /100 | #265 | Tragic 43.5% |
| Ecuadorians | 0.1 /100 | #266 | Tragic 43.5% |
| Natives/Alaskans | 0.1 /100 | #267 | Tragic 43.5% |
| Immigrants | Burma/Myanmar | 0.1 /100 | #268 | Tragic 43.4% |
| Immigrants | Sierra Leone | 0.1 /100 | #269 | Tragic 43.3% |
| Yuman | 0.1 /100 | #270 | Tragic 43.3% |
| Guatemalans | 0.1 /100 | #271 | Tragic 43.3% |
| Immigrants | Nigeria | 0.1 /100 | #272 | Tragic 43.2% |
| Ethiopians | 0.1 /100 | #273 | Tragic 43.2% |
| Nigerians | 0.1 /100 | #274 | Tragic 43.2% |