Immigrants from Bolivia vs Immigrants from Yemen Births to Unmarried Women
COMPARE
Immigrants from Bolivia
Immigrants from Yemen
Births to Unmarried Women
Births to Unmarried Women Comparison
Immigrants from Bolivia
Immigrants from Yemen
28.6%
BIRTHS TO UNMARRIED WOMEN
98.5/ 100
METRIC RATING
74th/ 347
METRIC RANK
31.7%
BIRTHS TO UNMARRIED WOMEN
50.2/ 100
METRIC RATING
173rd/ 347
METRIC RANK
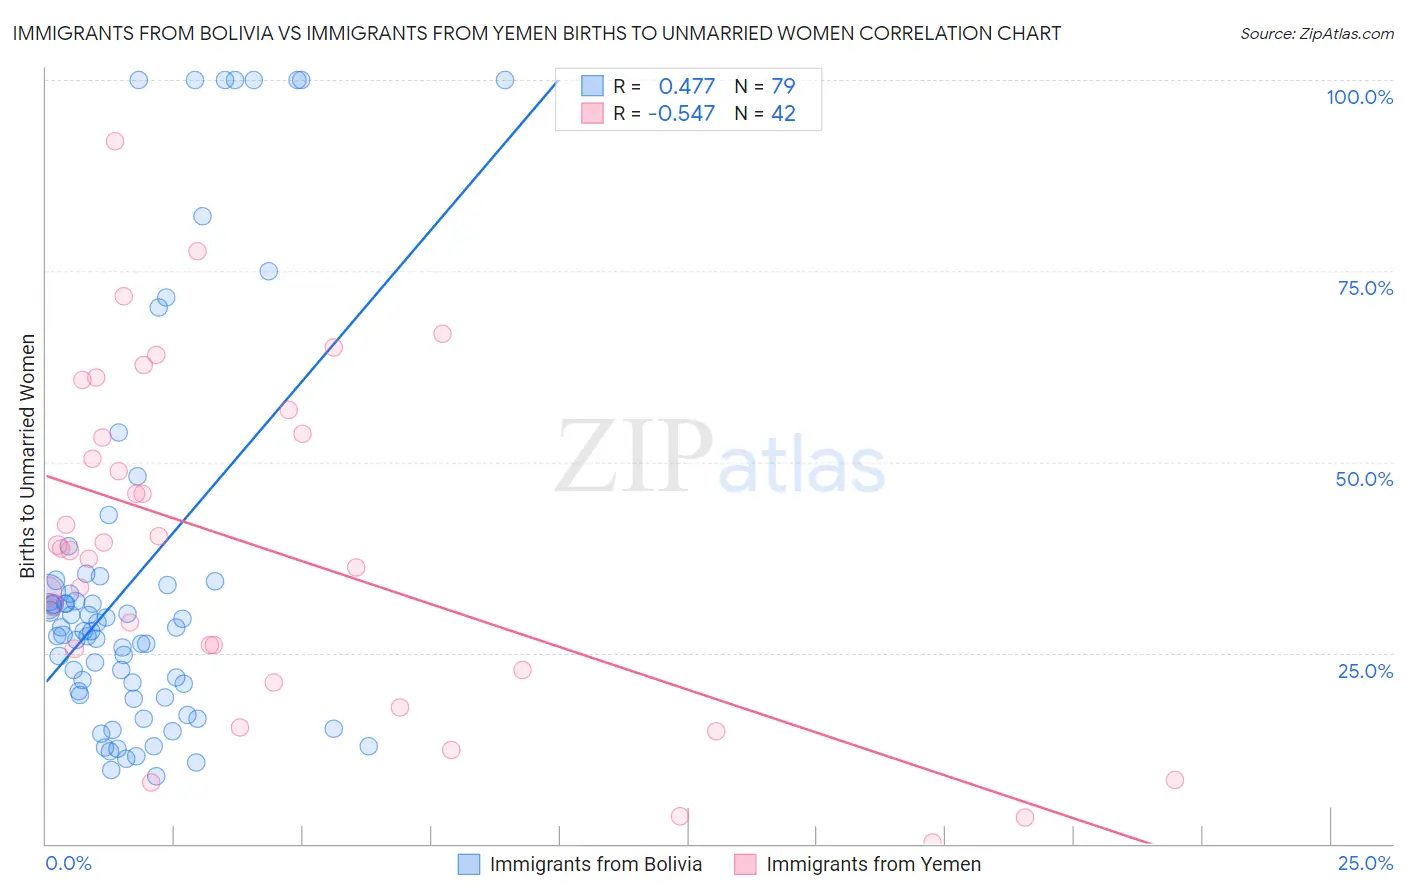
Immigrants from Bolivia vs Immigrants from Yemen Births to Unmarried Women Correlation Chart
The statistical analysis conducted on geographies consisting of 153,801,306 people shows a moderate positive correlation between the proportion of Immigrants from Bolivia and percentage of births to unmarried women in the United States with a correlation coefficient (R) of 0.477 and weighted average of 28.6%. Similarly, the statistical analysis conducted on geographies consisting of 81,136,879 people shows a substantial negative correlation between the proportion of Immigrants from Yemen and percentage of births to unmarried women in the United States with a correlation coefficient (R) of -0.547 and weighted average of 31.7%, a difference of 10.9%.
Births to Unmarried Women Correlation Summary
| Measurement | Immigrants from Bolivia | Immigrants from Yemen |
| Minimum | 8.9% | 0.20% |
| Maximum | 100.0% | 92.0% |
| Range | 91.1% | 91.8% |
| Mean | 35.2% | 38.5% |
| Median | 27.9% | 38.5% |
| Interquartile 25% (IQ1) | 19.4% | 22.7% |
| Interquartile 75% (IQ3) | 34.4% | 53.7% |
| Interquartile Range (IQR) | 15.0% | 31.0% |
| Standard Deviation (Sample) | 25.9% | 21.8% |
| Standard Deviation (Population) | 25.8% | 21.6% |
Similar Demographics by Births to Unmarried Women
Demographics Similar to Immigrants from Bolivia by Births to Unmarried Women
In terms of births to unmarried women, the demographic groups most similar to Immigrants from Bolivia are Albanian (28.5%, a difference of 0.020%), Immigrants from Sweden (28.5%, a difference of 0.070%), Immigrants from Switzerland (28.6%, a difference of 0.090%), Israeli (28.6%, a difference of 0.10%), and Jordanian (28.5%, a difference of 0.13%).
| Demographics | Rating | Rank | Births to Unmarried Women |
| Palestinians | 98.7 /100 | #67 | Exceptional 28.4% |
| Immigrants | Europe | 98.7 /100 | #68 | Exceptional 28.4% |
| Bolivians | 98.7 /100 | #69 | Exceptional 28.5% |
| Laotians | 98.6 /100 | #70 | Exceptional 28.5% |
| Jordanians | 98.5 /100 | #71 | Exceptional 28.5% |
| Immigrants | Sweden | 98.5 /100 | #72 | Exceptional 28.5% |
| Albanians | 98.5 /100 | #73 | Exceptional 28.5% |
| Immigrants | Bolivia | 98.5 /100 | #74 | Exceptional 28.6% |
| Immigrants | Switzerland | 98.4 /100 | #75 | Exceptional 28.6% |
| Israelis | 98.4 /100 | #76 | Exceptional 28.6% |
| Immigrants | Northern Europe | 98.3 /100 | #77 | Exceptional 28.6% |
| Zimbabweans | 98.2 /100 | #78 | Exceptional 28.7% |
| Danes | 98.2 /100 | #79 | Exceptional 28.7% |
| Immigrants | Afghanistan | 98.1 /100 | #80 | Exceptional 28.7% |
| Immigrants | Austria | 98.1 /100 | #81 | Exceptional 28.7% |
Demographics Similar to Immigrants from Yemen by Births to Unmarried Women
In terms of births to unmarried women, the demographic groups most similar to Immigrants from Yemen are Immigrants from Eritrea (31.7%, a difference of 0.020%), Venezuelan (31.7%, a difference of 0.020%), Finnish (31.7%, a difference of 0.030%), Guamanian/Chamorro (31.6%, a difference of 0.10%), and Immigrants from Venezuela (31.7%, a difference of 0.10%).
| Demographics | Rating | Rank | Births to Unmarried Women |
| Peruvians | 55.5 /100 | #166 | Average 31.5% |
| Dutch | 55.3 /100 | #167 | Average 31.5% |
| Belgians | 52.4 /100 | #168 | Average 31.6% |
| Slavs | 52.0 /100 | #169 | Average 31.6% |
| Guamanians/Chamorros | 51.3 /100 | #170 | Average 31.6% |
| Finns | 50.5 /100 | #171 | Average 31.7% |
| Immigrants | Eritrea | 50.4 /100 | #172 | Average 31.7% |
| Immigrants | Yemen | 50.2 /100 | #173 | Average 31.7% |
| Venezuelans | 50.0 /100 | #174 | Average 31.7% |
| Immigrants | Venezuela | 49.2 /100 | #175 | Average 31.7% |
| Scottish | 48.1 /100 | #176 | Average 31.7% |
| South American Indians | 47.7 /100 | #177 | Average 31.7% |
| English | 47.4 /100 | #178 | Average 31.7% |
| South Americans | 46.9 /100 | #179 | Average 31.8% |
| Moroccans | 45.7 /100 | #180 | Average 31.8% |