Immigrants from Bangladesh vs Bulgarian Householder Income Under 25 years
COMPARE
Immigrants from Bangladesh
Bulgarian
Householder Income Under 25 years
Householder Income Under 25 years Comparison
Immigrants from Bangladesh
Bulgarians
$54,714
HOUSEHOLDER INCOME UNDER 25 YEARS
99.8/ 100
METRIC RATING
66th/ 347
METRIC RANK
$54,352
HOUSEHOLDER INCOME UNDER 25 YEARS
99.5/ 100
METRIC RATING
84th/ 347
METRIC RANK
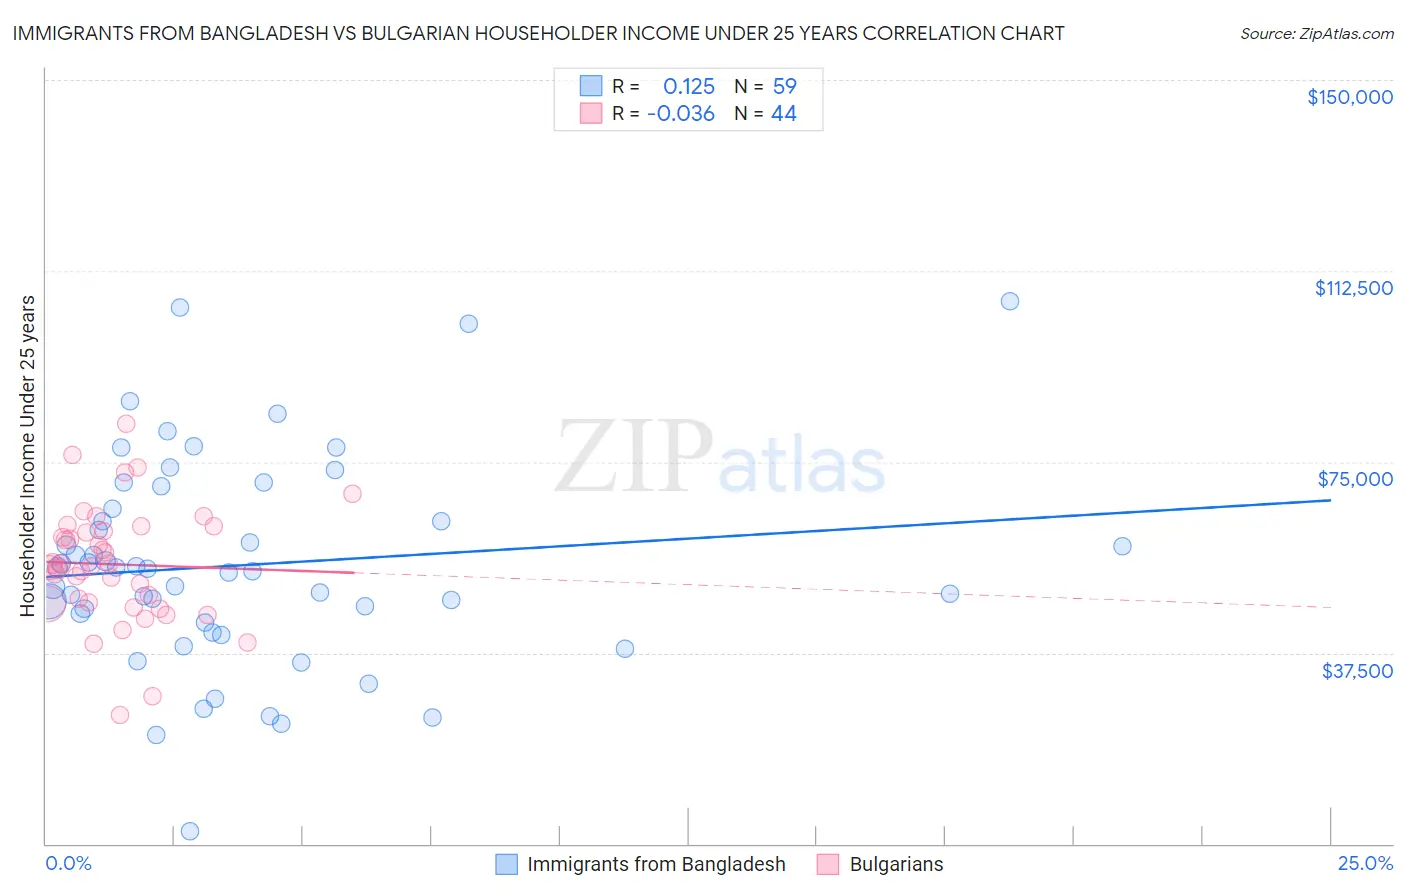
Immigrants from Bangladesh vs Bulgarian Householder Income Under 25 years Correlation Chart
The statistical analysis conducted on geographies consisting of 182,124,720 people shows a poor positive correlation between the proportion of Immigrants from Bangladesh and household income with householder under the age of 25 in the United States with a correlation coefficient (R) of 0.125 and weighted average of $54,714. Similarly, the statistical analysis conducted on geographies consisting of 184,447,475 people shows no correlation between the proportion of Bulgarians and household income with householder under the age of 25 in the United States with a correlation coefficient (R) of -0.036 and weighted average of $54,352, a difference of 0.67%.
Householder Income Under 25 years Correlation Summary
| Measurement | Immigrants from Bangladesh | Bulgarian |
| Minimum | $2,499 | $25,208 |
| Maximum | $106,635 | $82,576 |
| Range | $104,136 | $57,368 |
| Mean | $54,726 | $54,870 |
| Median | $54,089 | $54,743 |
| Interquartile 25% (IQ1) | $43,482 | $47,263 |
| Interquartile 75% (IQ3) | $65,885 | $61,883 |
| Interquartile Range (IQR) | $22,403 | $14,621 |
| Standard Deviation (Sample) | $20,541 | $11,464 |
| Standard Deviation (Population) | $20,367 | $11,333 |
Demographics Similar to Immigrants from Bangladesh and Bulgarians by Householder Income Under 25 years
In terms of householder income under 25 years, the demographic groups most similar to Immigrants from Bangladesh are Okinawan ($54,701, a difference of 0.020%), Yup'ik ($54,732, a difference of 0.030%), Tsimshian ($54,649, a difference of 0.12%), Samoan ($54,610, a difference of 0.19%), and Immigrants from El Salvador ($54,599, a difference of 0.21%). Similarly, the demographic groups most similar to Bulgarians are Immigrants from Czechoslovakia ($54,352, a difference of 0.0%), Laotian ($54,369, a difference of 0.030%), Russian ($54,389, a difference of 0.070%), Portuguese ($54,436, a difference of 0.16%), and Egyptian ($54,444, a difference of 0.17%).
| Demographics | Rating | Rank | Householder Income Under 25 years |
| Yup'ik | 99.8 /100 | #65 | Exceptional $54,732 |
| Immigrants | Bangladesh | 99.8 /100 | #66 | Exceptional $54,714 |
| Okinawans | 99.8 /100 | #67 | Exceptional $54,701 |
| Tsimshian | 99.8 /100 | #68 | Exceptional $54,649 |
| Samoans | 99.7 /100 | #69 | Exceptional $54,610 |
| Immigrants | El Salvador | 99.7 /100 | #70 | Exceptional $54,599 |
| Immigrants | Morocco | 99.7 /100 | #71 | Exceptional $54,593 |
| Immigrants | Northern Europe | 99.7 /100 | #72 | Exceptional $54,571 |
| Macedonians | 99.7 /100 | #73 | Exceptional $54,563 |
| Immigrants | Grenada | 99.7 /100 | #74 | Exceptional $54,538 |
| Immigrants | Sri Lanka | 99.7 /100 | #75 | Exceptional $54,512 |
| Immigrants | Brazil | 99.6 /100 | #76 | Exceptional $54,487 |
| Immigrants | Southern Europe | 99.6 /100 | #77 | Exceptional $54,484 |
| Nepalese | 99.6 /100 | #78 | Exceptional $54,472 |
| Immigrants | Italy | 99.6 /100 | #79 | Exceptional $54,449 |
| Egyptians | 99.6 /100 | #80 | Exceptional $54,444 |
| Portuguese | 99.6 /100 | #81 | Exceptional $54,436 |
| Russians | 99.5 /100 | #82 | Exceptional $54,389 |
| Laotians | 99.5 /100 | #83 | Exceptional $54,369 |
| Bulgarians | 99.5 /100 | #84 | Exceptional $54,352 |
| Immigrants | Czechoslovakia | 99.5 /100 | #85 | Exceptional $54,352 |