Immigrants from the Azores vs Immigrants from Germany Average Family Size
COMPARE
Immigrants from the Azores
Immigrants from Germany
Average Family Size
Average Family Size Comparison
Immigrants from the Azores
Immigrants from Germany
3.21
AVERAGE FAMILY SIZE
21.7/ 100
METRIC RATING
198th/ 347
METRIC RANK
3.15
AVERAGE FAMILY SIZE
0.7/ 100
METRIC RATING
271st/ 347
METRIC RANK
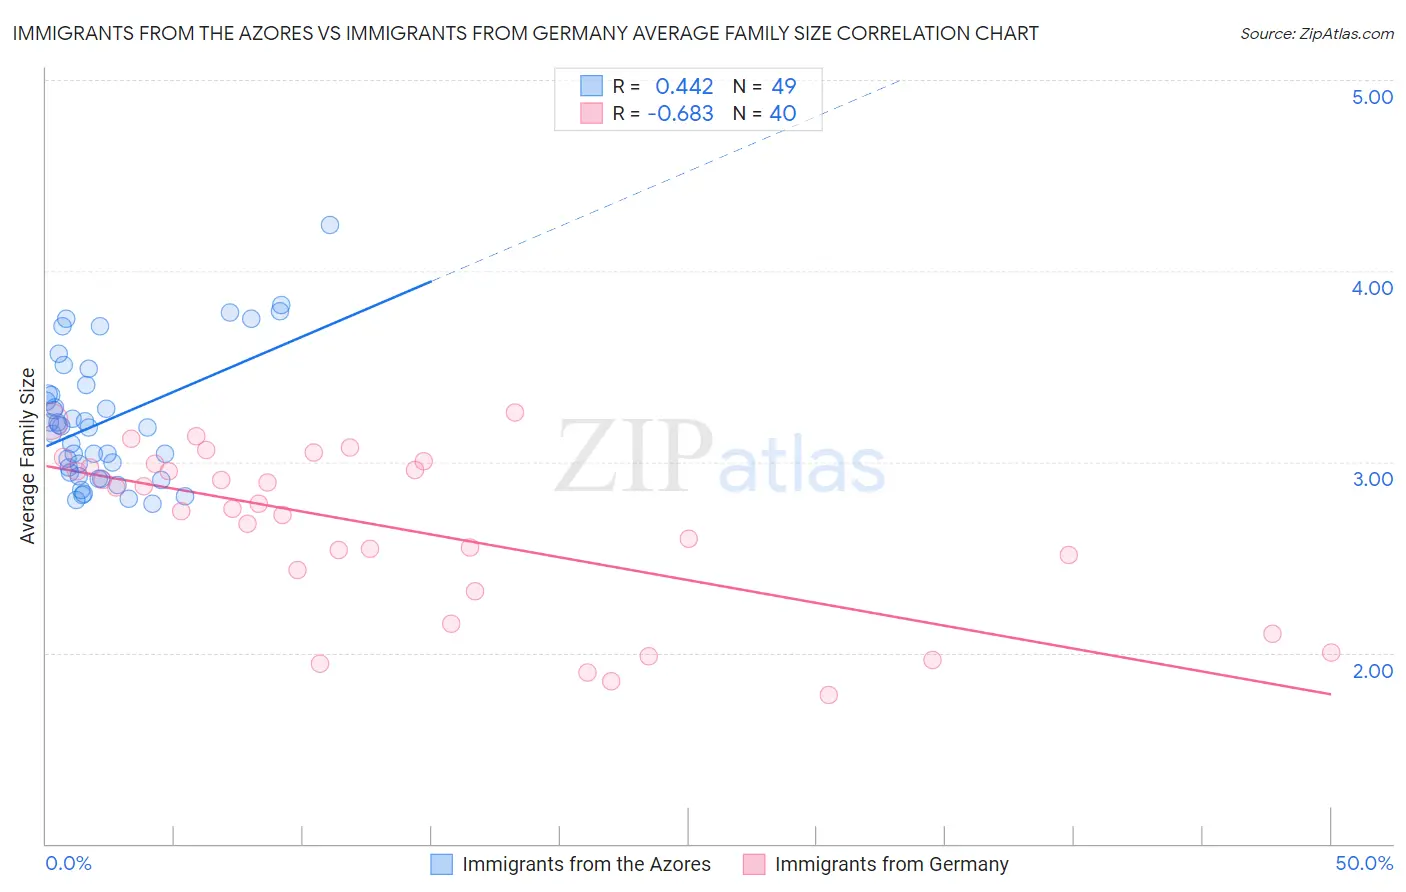
Immigrants from the Azores vs Immigrants from Germany Average Family Size Correlation Chart
The statistical analysis conducted on geographies consisting of 46,257,310 people shows a moderate positive correlation between the proportion of Immigrants from the Azores and average family size in the United States with a correlation coefficient (R) of 0.442 and weighted average of 3.21. Similarly, the statistical analysis conducted on geographies consisting of 463,759,873 people shows a significant negative correlation between the proportion of Immigrants from Germany and average family size in the United States with a correlation coefficient (R) of -0.683 and weighted average of 3.15, a difference of 1.7%.
Average Family Size Correlation Summary
| Measurement | Immigrants from the Azores | Immigrants from Germany |
| Minimum | 2.78 | 1.78 |
| Maximum | 4.24 | 3.26 |
| Range | 1.46 | 1.48 |
| Mean | 3.22 | 2.65 |
| Median | 3.18 | 2.77 |
| Interquartile 25% (IQ1) | 2.93 | 2.38 |
| Interquartile 75% (IQ3) | 3.38 | 2.98 |
| Interquartile Range (IQR) | 0.44 | 0.60 |
| Standard Deviation (Sample) | 0.34 | 0.43 |
| Standard Deviation (Population) | 0.34 | 0.43 |
Similar Demographics by Average Family Size
Demographics Similar to Immigrants from the Azores by Average Family Size
In terms of average family size, the demographic groups most similar to Immigrants from the Azores are Hmong (3.21, a difference of 0.020%), Immigrants from Kenya (3.21, a difference of 0.070%), Immigrants from Morocco (3.21, a difference of 0.090%), Immigrants from India (3.21, a difference of 0.090%), and Immigrants from Nepal (3.21, a difference of 0.10%).
| Demographics | Rating | Rank | Average Family Size |
| Immigrants | Zaire | 30.5 /100 | #191 | Fair 3.22 |
| Immigrants | Eastern Africa | 30.1 /100 | #192 | Fair 3.22 |
| Immigrants | Israel | 29.3 /100 | #193 | Fair 3.22 |
| Immigrants | Sudan | 29.1 /100 | #194 | Fair 3.22 |
| Choctaw | 28.3 /100 | #195 | Fair 3.21 |
| Senegalese | 28.2 /100 | #196 | Fair 3.21 |
| Kenyans | 28.0 /100 | #197 | Fair 3.21 |
| Immigrants | Azores | 21.7 /100 | #198 | Fair 3.21 |
| Hmong | 20.7 /100 | #199 | Fair 3.21 |
| Immigrants | Kenya | 19.2 /100 | #200 | Poor 3.21 |
| Immigrants | Morocco | 18.5 /100 | #201 | Poor 3.21 |
| Immigrants | India | 18.5 /100 | #202 | Poor 3.21 |
| Immigrants | Nepal | 18.1 /100 | #203 | Poor 3.21 |
| Immigrants | Poland | 16.6 /100 | #204 | Poor 3.20 |
| Paraguayans | 16.3 /100 | #205 | Poor 3.20 |
Demographics Similar to Immigrants from Germany by Average Family Size
In terms of average family size, the demographic groups most similar to Immigrants from Germany are Tlingit-Haida (3.16, a difference of 0.020%), Immigrants from Lithuania (3.15, a difference of 0.020%), New Zealander (3.15, a difference of 0.030%), Immigrants from Belgium (3.15, a difference of 0.030%), and Cambodian (3.15, a difference of 0.040%).
| Demographics | Rating | Rank | Average Family Size |
| Americans | 1.0 /100 | #264 | Tragic 3.16 |
| Immigrants | South Africa | 0.9 /100 | #265 | Tragic 3.16 |
| Immigrants | Greece | 0.9 /100 | #266 | Tragic 3.16 |
| Iroquois | 0.8 /100 | #267 | Tragic 3.16 |
| Maltese | 0.8 /100 | #268 | Tragic 3.16 |
| Immigrants | Singapore | 0.7 /100 | #269 | Tragic 3.16 |
| Tlingit-Haida | 0.7 /100 | #270 | Tragic 3.16 |
| Immigrants | Germany | 0.7 /100 | #271 | Tragic 3.15 |
| Immigrants | Lithuania | 0.6 /100 | #272 | Tragic 3.15 |
| New Zealanders | 0.6 /100 | #273 | Tragic 3.15 |
| Immigrants | Belgium | 0.6 /100 | #274 | Tragic 3.15 |
| Cambodians | 0.6 /100 | #275 | Tragic 3.15 |
| Immigrants | Bosnia and Herzegovina | 0.5 /100 | #276 | Tragic 3.15 |
| Swiss | 0.5 /100 | #277 | Tragic 3.15 |
| Okinawans | 0.5 /100 | #278 | Tragic 3.15 |